- Overview
- Tutorials
- How Tos
- Download
- Install
- Configure
- Secure
- TLS API Configuration
- Configure API Authentication and Authorization with JWT
- Configure API Limits
- Set Resource Limits
- Crypto key management
- Restrict key usage
- Namespace Key Management
- Key management service (KMS) configuration
- Optimize
- Observe
- Operate
- Initializing node identity manually
- Canton Console
- Synchronizer connections
- High Availability Usage
- Manage Daml packages and archives
- Participant Node pruning
- Party Management
- Party replication
- Decentralized party overview
- Setup an External Party
- Ledger API User Management
- Node Traffic Management
- Identity Management
- Upgrade
- Decommission
- Recover
- Troubleshoot
- Explanations
- Reference
Note
This page is a work in progress. It may contain incomplete or incorrect information.
Monitoring Best Practices
Introduction
Observability (also known as “monitoring”) lets you determine if the Daml Enterprise solution is healthy or not. If the state is not healthy, observability helps diagnose the root cause. There are three parts to observability: metrics, logs, and traces. These are described in this section.
To avoid becoming overwhelmed by the number of metrics and log messages, follow these steps:
Read the shortcut to learning what is important, which is described below in the section Hands-On with the Daml Enterprise - Observability Example as a starting point and inspiration when building your metric monitoring.
For an overview of how most metrics are exposed, read the section Golden Signals and Key Metrics Quick Start below. It describes the philosophy behind metric naming and labeling.
The remaining sections provide references to more detailed information.
Hands-On with the Daml Enterprise - Observability Example
The Daml Enterprise - Observability Example GitHub repository provides a complete reference example for exploring the metrics that Daml Enterprise exposes. You can use it to explore the collection, aggregation, filtering, and visualization of metrics. It is self-contained, with the following components:
An example Docker compose file to create a run-time for all the components
Some shell scripts to generate requests to the Daml Enterprise solution
A Prometheus config file to scrape the metrics data
A Grafana template file(s) to visualize the metrics in a meaningful way, such as shown below in the example dashboard
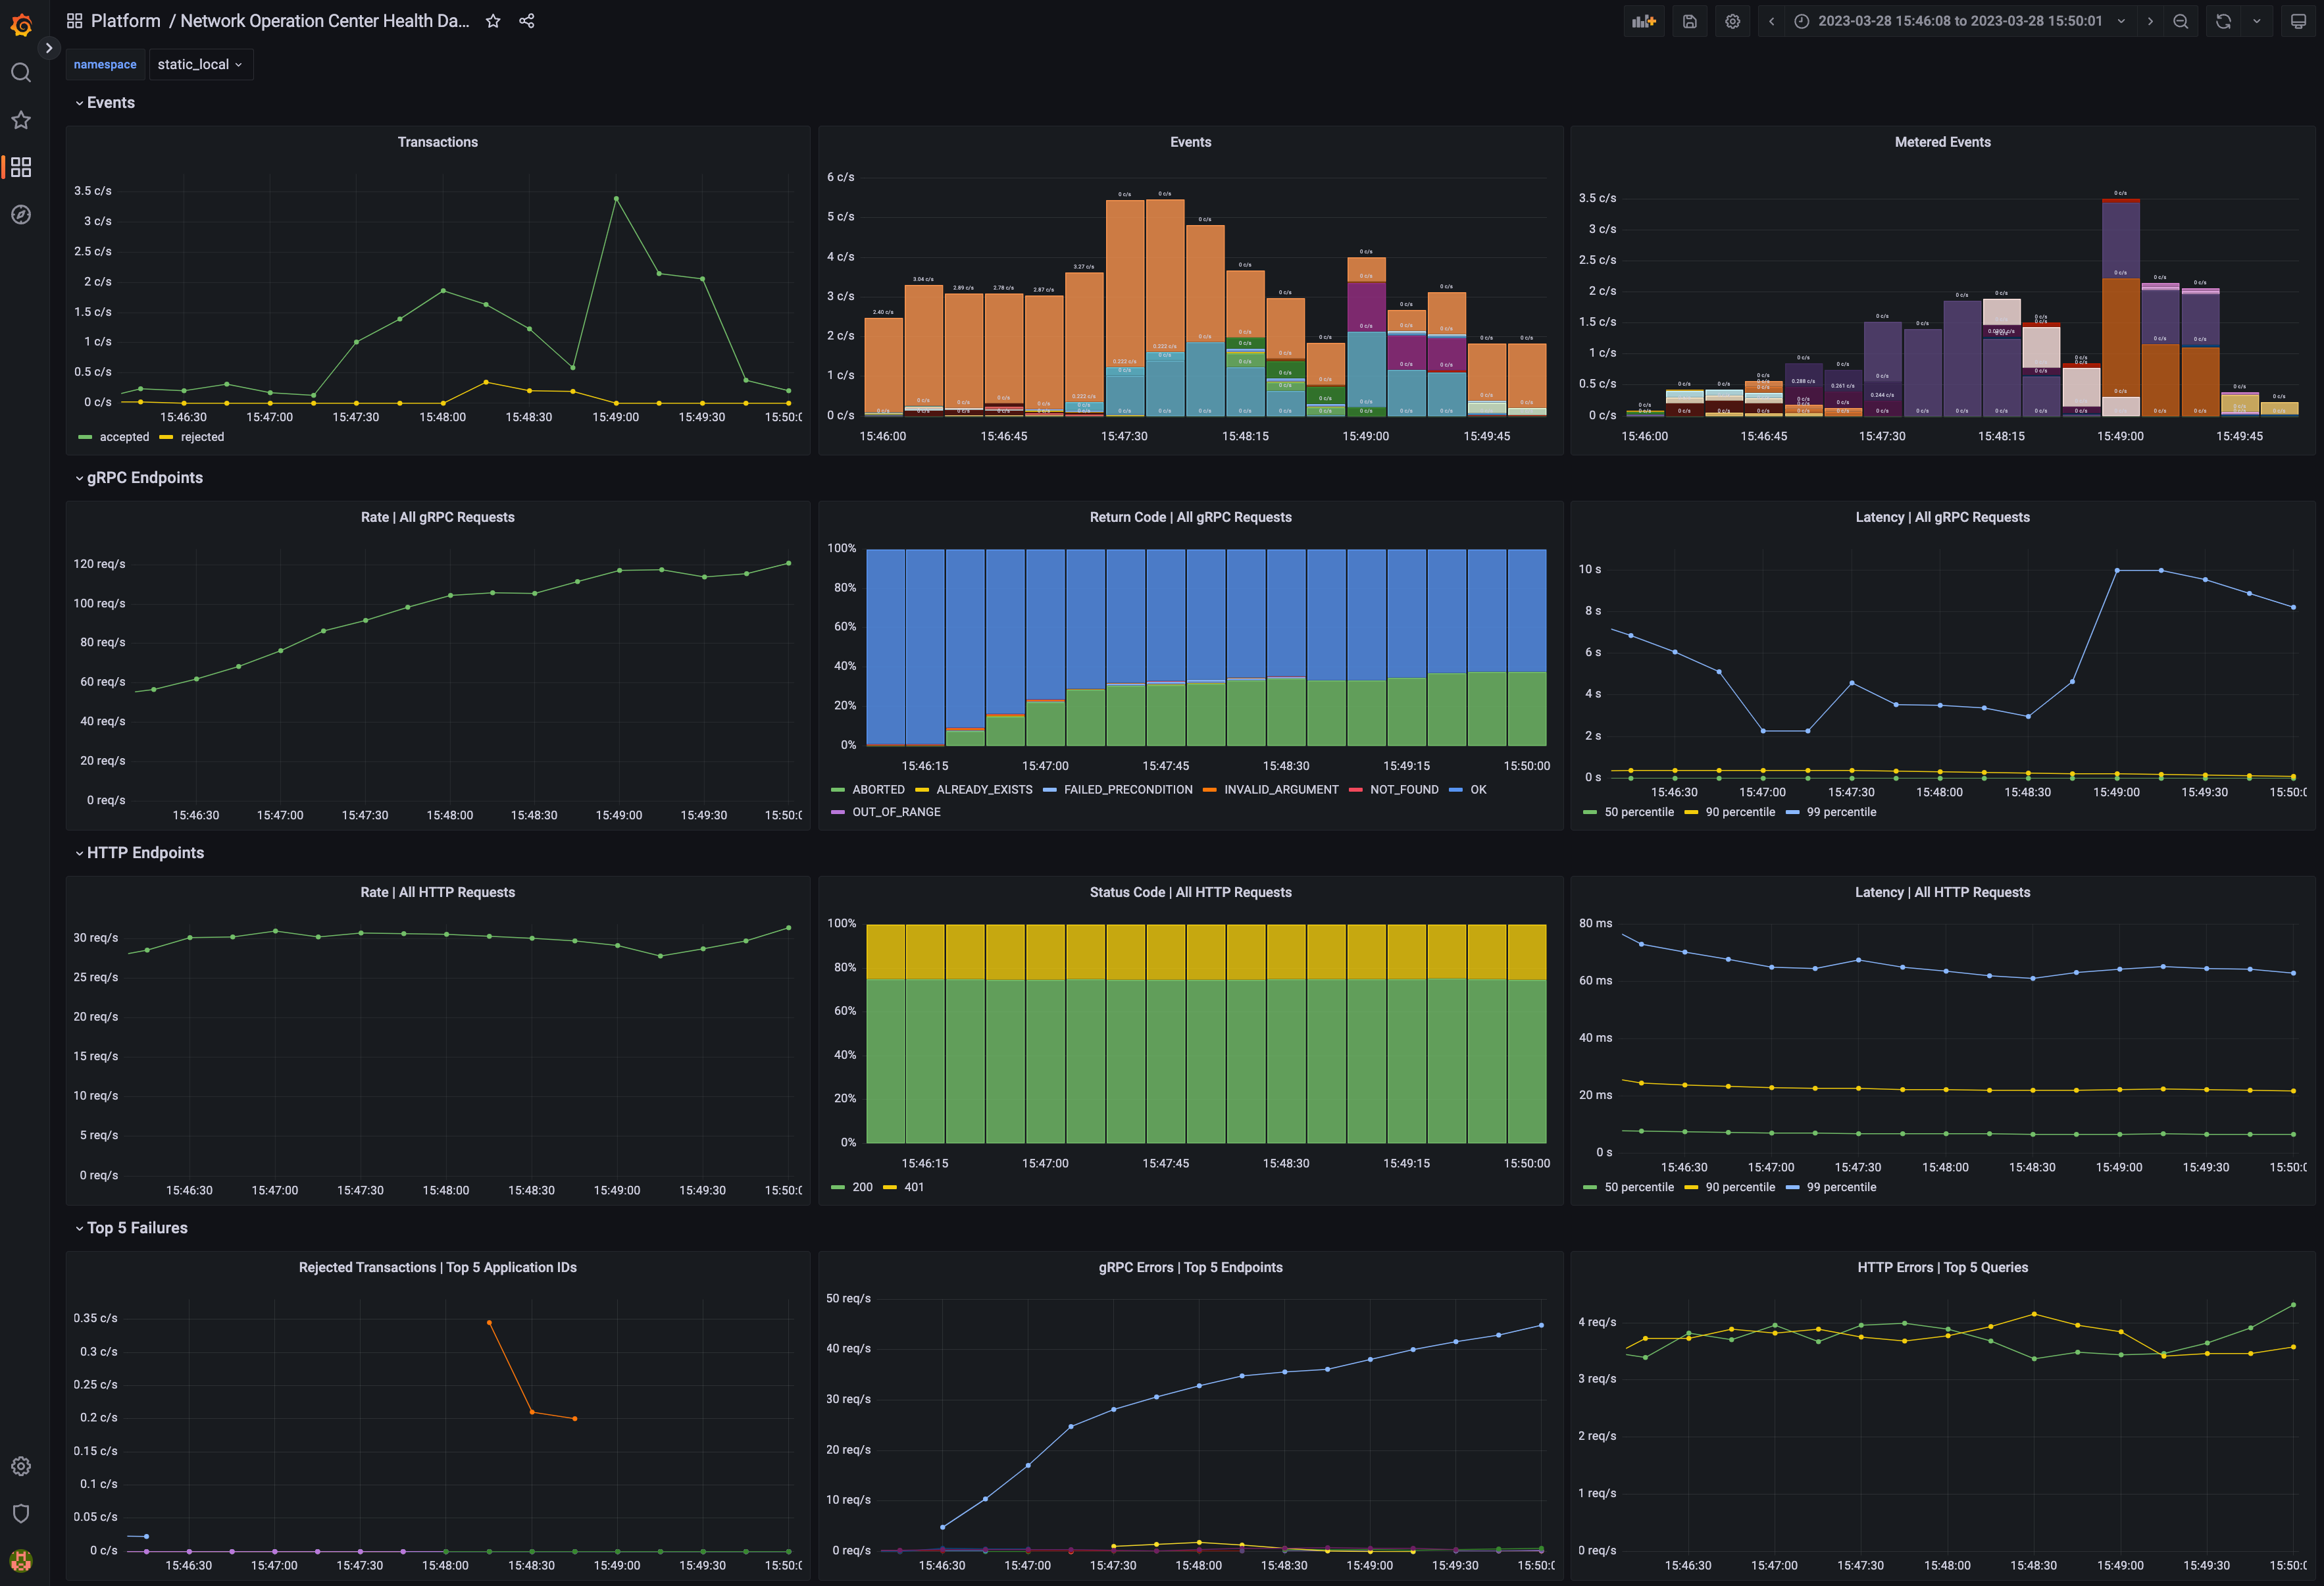
Dashboard with metrics
Golden Signals and Key Metrics Quick Start
The best practice for monitoring a microservices application is an approach known as the Golden Signals, or the RED method. In this approach, metric monitoring determines whether the application is healthy and, if not healthy, which service is the root cause of the issue. The Golden Signals for HTTP and gRPC endpoints are supported for all endpoints. Key metrics specific to Daml Enterprises are also available. These are described below.
The following Golden Signal metrics for each HTTP and gRPC API are available:
Input request rate, as a counter
Error rate, as a counter (discussed below)
Latency (the time to process a request), as a histogram
Size of the payload, as a counter, following the Apache HTTP precedent
You can filter or aggregate each metric using its accompanying labels. The instrumentation labels added to each HTTP API metric are as follows:
http_verb: the HTTP verb (for example: GET, POST)http_status: the status code (for example: 200, 401, 403, 504)host: the host identifierdaml_version: the Daml release numberservice: a string to identify what Daml service or Canton component is running in this process (for example:participant,sequencer,json_api)path: the request made to the endpoint (for example:/v2/commands/submit-and-wait,/v2/state/active-contracts)
The gRPC protocol is layered on top of HTTP/2, so certain labels (such as the daml_version and service) from the above section are included. The labels added by default to each gRPC API metric are as follows:
canton_version: the Canton protocol versiongrpc_code: the human-readable status code for gRPC (for example:OK,CANCELLED,DEADLINE_EXCEEDED)The type of the client/server gRPC request, under the labels
grpc_client_typeandgrpc_server_typeThe protobuf package and service names, under the labels
grpc_service_nameandgrpc_method_name
The following other key metrics are monitored:
A binary gauge indicates whether the node is healthy or not healthy. This can also be used to infer which node is passive in a highly available configuration because it will show as not being healthy, while the active node is always healthy.
A binary gauge signals whether a node is active or passive, for identifying which node is the active node.
A binary gauge detects when pruning is occurring.
Each participant node measures the count of the inflight (dirty) requests so the user can see if
maxDirtyRequestslimit is close to being hit. The metrics are:canton_dirty_requestsandcanton_max_dirty_requests.Each participant node records the distribution of events (updates) received by the participant and allows drill-down by event type (package upload, party creation, or transaction), status (success or failure), participant ID, and application ID (if available). The counter is called
daml_indexer_events_total.The ledger event requests are totaled in a counter called
daml_indexer_metered_events_total.JVM garbage collection metrics are collected.
This list is not exhaustive. It highlights the most important metrics.
Set Up Metrics Scraping
Enable the Prometheus Reporter
Prometheus is recommended for metrics reporting. Other reporters (jmx, graphite, and csv) are supported, but they are deprecated. Any such reporter should be migrated to Prometheus.
Prometheus can be enabled using:
canton.monitoring.metrics.reporters = [{
  type = prometheus
  address = "localhost" // default
  port = 9000 // default
}]
Prometheus-Only Metrics
Some metrics are available only when using the Prometheus reporter. These metrics include common gRPC and HTTP metrics (which help you to measure the four golden signals), and JVM GC and memory usage metrics (if enabled). The metrics are documented in detail below.
Any metric marked with * is available only when using the Prometheus reporter.
Deprecated Reporters
JMX-based reporting (for testing purposes only) can be enabled using:
canton.monitoring.metrics.reporters = [{ type = jmx }]
Additionally, metrics can be written to a file:
canton.monitoring.metrics.reporters = [{
  type = jmx
}, {
  type = csv
  directory = "metrics"
  interval = 5s // default
  filters = [{
    contains = "canton"
  }]
}]
or reported via Graphite (to Grafana) using:
canton.monitoring.metrics.reporters = [{
  type = graphite
  address = "localhost" // default
  port = 2003
  prefix.type = hostname // default
  interval = 30s // default
  filters = [{
    contains = "canton"
  }]
}]
When using the graphite or the csv reporter, Canton periodically evaluates all metrics matching the given filters. Filter for only those metrics that are relevant to you.
In addition to Canton metrics, the process can also report Daml metrics (of the Ledger API server). Optionally, JVM metrics can be included using:
canton.monitoring.metrics.report-jvm-metrics = yes // default no
Metrics
The following sections contain the common metrics exposed for Daml services supporting a Prometheus metrics reporter.
For the metric types referenced below, see the relevant Prometheus documentation.
Participant Metrics
daml.cache.evicted_weight
Summary: The sum of weights of cache entries evicted.
Description: The total weight of the entries evicted from the cache.
Type: counter
Qualification: Debug
daml.cache.evictions
Summary: The number of the evicted cache entries.
Description: When an entry is evicted from the cache, the counter is incremented.
Type: counter
Qualification: Debug
daml.cache.hits
Summary: The number of cache hits.
Description: When a cache lookup encounters an existing cache entry, the counter is incremented.
Type: counter
Qualification: Debug
daml.cache.misses
Summary: The number of cache misses.
Description: When a cache lookup first encounters a missing cache entry, the counter is incremented.
Type: counter
Qualification: Debug
daml.db-storage.general.executor.exectime
Summary: Execution time metric for database tasks
Description: The time a task is running on the database is measured using this metric.
Type: timer
Qualification: Debug
daml.db-storage.general.executor.load
Summary: Load of database pool
Description: Database queries run as tasks on an async executor. This metric shows the current number of queries running in parallel divided by the number database connections for this database connection pool.
Type: gauge
Qualification: Saturation
daml.db-storage.general.executor.queued
Summary: Number of database access tasks waiting in queue
Description: Database access tasks get scheduled in this queue and get executed using one of the existing asynchronous sessions. A large queue indicates that the database connection is not able to deal with the large number of requests. Note that the queue has a maximum size. Tasks that do not fit into the queue will be retried, but won’t show up in this metric.
Type: counter
Qualification: Saturation
daml.db-storage.general.executor.running
Summary: Number of database access tasks currently running
Description: Database access tasks run on an async executor. This metric shows the current number of tasks running in parallel.
Type: gauge
Qualification: Debug
daml.db-storage.general.executor.waittime
Summary: Scheduling time metric for database tasks
Description: Every database query is scheduled using an asynchronous executor with a queue. The time a task is waiting in this queue is monitored using this metric.
Type: timer
Qualification: Debug
daml.db-storage.write.executor.exectime
Summary: Execution time metric for database tasks
Description: The time a task is running on the database is measured using this metric.
Type: timer
Qualification: Debug
daml.db-storage.write.executor.load
Summary: Load of database pool
Description: Database queries run as tasks on an async executor. This metric shows the current number of queries running in parallel divided by the number database connections for this database connection pool.
Type: gauge
Qualification: Saturation
daml.db-storage.write.executor.queued
Summary: Number of database access tasks waiting in queue
Description: Database access tasks get scheduled in this queue and get executed using one of the existing asynchronous sessions. A large queue indicates that the database connection is not able to deal with the large number of requests. Note that the queue has a maximum size. Tasks that do not fit into the queue will be retried, but won’t show up in this metric.
Type: counter
Qualification: Saturation
daml.db-storage.write.executor.running
Summary: Number of database access tasks currently running
Description: Database access tasks run on an async executor. This metric shows the current number of tasks running in parallel.
Type: gauge
Qualification: Debug
daml.db-storage.write.executor.waittime
Summary: Scheduling time metric for database tasks
Description: Every database query is scheduled using an asynchronous executor with a queue. The time a task is waiting in this queue is monitored using this metric.
Type: timer
Qualification: Debug
daml.db.commit*
Summary: The time needed to perform the SQL query commit.
Description: This metric measures the time it takes to commit an SQL transaction relating to the <operation>. It roughly corresponds to calling commit() on a DB connection.
Type: timer
Qualification: Debug
- Labels:
name: The operation/pool for which the metric is registered.
daml.db.compression*
Summary: The time needed to decompress the SQL query result.
Description: Some index database queries that target contracts involve a decompression step. For such queries this metric represents the time it takes to decompress contract arguments retrieved from the database.
Type: timer
Qualification: Debug
- Labels:
name: The operation/pool for which the metric is registered.
daml.db.exec*
Summary: The time needed to run the SQL query and read the result.
Description: This metric encompasses the time measured by query and commit metrics. Additionally it includes the time needed to obtain the DB connection, optionally roll it back and close the connection at the end.
Type: timer
Qualification: Debug
- Labels:
name: The operation/pool for which the metric is registered.
daml.db.query*
Summary: The time needed to run the SQL query.
Description: This metric measures the time it takes to execute a block of code (on a dedicated executor) related to the <operation> that can issue multiple SQL statements such that all run in a single DB transaction (either committed or aborted).
Type: timer
Qualification: Debug
- Labels:
name: The operation/pool for which the metric is registered.
daml.db.translation*
Summary: The time needed to turn serialized Daml-LF values into in-memory objects.
Description: Some index database queries that target contracts and transactions involve a Daml-LF translation step. For such queries this metric stands for the time it takes to turn the serialized Daml-LF values into in-memory representation.
Type: timer
Qualification: Debug
- Labels:
name: The operation/pool for which the metric is registered.
daml.db.wait*
Summary: The time needed to acquire a connection to the database.
Description: SQL statements are run in a dedicated executor. This metric measures the time it takes between creating the SQL statement corresponding to the <operation> and the point when it starts running on the dedicated executor.
Type: timer
Qualification: Debug
- Labels:
name: The operation/pool for which the metric is registered.
daml.grpc.server
Summary: Distribution of the durations of serving gRPC requests.
Description:
Type: timer
Qualification: Latency
daml.grpc.server.handled
Summary: Total number of handled gRPC requests.
Description:
Type: meter
Qualification: Traffic
daml.grpc.server.messages.received
Summary: Total number of gRPC messages received (on either type of connection).
Description:
Type: meter
Qualification: Traffic
daml.grpc.server.messages.received.bytes
Summary: Distribution of payload sizes in gRPC messages received (both unary and streaming).
Description:
Type: histogram
Qualification: Traffic
daml.grpc.server.messages.sent
Summary: Total number of gRPC messages sent (on either type of connection).
Description:
Type: meter
Qualification: Traffic
daml.grpc.server.messages.sent.bytes
Summary: Distribution of payload sizes in gRPC messages sent (both unary and streaming).
Description:
Type: histogram
Qualification: Traffic
daml.grpc.server.requests.rejections*
Summary: Number of rejected requests due to active request limits.
Description: Counts the number of requests rejected because the active request limit was reached.
Type: counter
Qualification: Saturation
- Labels:
method: The method / service name limited.
service: The API the method belongs to
api: The API the method belongs to
daml.grpc.server.started
Summary: Total number of started gRPC requests (on either type of connection).
Description:
Type: meter
Qualification: Traffic
daml.http.requests
Summary: Total number of HTTP requests received.
Description:
Type: meter
Qualification: Debug
daml.http.requests
Summary: The duration of the HTTP requests.
Description:
Type: timer
Qualification: Debug
daml.http.requests.payload.bytes
Summary: Distribution of the sizes of payloads received in HTTP requests.
Description:
Type: histogram
Qualification: Debug
daml.http.responses.payload.bytes
Summary: Distribution of the sizes of payloads sent in HTTP responses.
Description:
Type: histogram
Qualification: Debug
daml.http.websocket.messages.received
Summary: Total number of received WebSocket messages.
Description:
Type: meter
Qualification: Debug
daml.http.websocket.messages.received.bytes
Summary: Distribution of the size of received WebSocket messages.
Description:
Type: histogram
Qualification: Debug
daml.http.websocket.messages.sent
Summary: Total number of sent WebSocket messages.
Description:
Type: meter
Qualification: Debug
daml.http.websocket.messages.sent.bytes
Summary: Distribution of the size of sent WebSocket messages.
Description:
Type: histogram
Qualification: Debug
daml.participant.api.commands.delayed_submissions
Summary: The number of the delayed Daml commands.
Description: The number of Daml commands that have been delayed internally because they have been evaluated to require the ledger time further in the future than the expected latency.
Type: meter
Qualification: Debug
daml.participant.api.commands.failed_command_interpretations
Summary: The number of Daml commands that failed in interpretation.
Description: The number of Daml commands that have been rejected by the interpreter (e.g. badly authorized action).
Type: meter
Qualification: Errors
daml.participant.api.commands.interactive_prepares
Summary: The time to prepare a transaction for interactive submission.
Description: The time to validate and interpret a command before it is returned to the caller for external signing.
Type: timer
Qualification: Latency
daml.participant.api.commands.max_in_flight_capacity
Summary: The maximum number of Daml commands that can await completion.
Description: The maximum number of Daml commands that can await completion in the Command Service.
Type: counter
Qualification: Debug
daml.participant.api.commands.max_in_flight_length
Summary: The number of the Daml commands awaiting completion.
Description: The number of the currently Daml commands awaiting completion in the Command Service.
Type: counter
Qualification: Debug
daml.participant.api.commands.prepares_running
Summary: The number of the Daml commands for which transactions are currently being prepared by the ledger api server.
Description: The number of the Daml commands that are currently being prepared by the ledger api server (including validation, interpretation).
Type: counter
Qualification: Saturation
daml.participant.api.commands.reassignment_validation
Summary: The time to validate a reassignment command.
Description: The time to validate a submitted Daml command before is fed to the interpreter.
Type: timer
Qualification: Debug
daml.participant.api.commands.submissions
Summary: The time to fully process a Daml command.
Description: The time to validate and interpret a command before it is handed over to the synchronization services to be finalized (either committed or rejected).
Type: timer
Qualification: Latency
daml.participant.api.commands.submissions_running
Summary: The number of the Daml commands that are currently being handled by the ledger api server.
Description: The number of the Daml commands that are currently being handled by the ledger api server (including validation, interpretation, and handing the transaction over to the synchronization services).
Type: counter
Qualification: Saturation
daml.participant.api.commands.taps_package_selection
Summary: The time spent on package selection in a single TAPS pass.
Description: The time spent on package selection in a single pass of the Topology-Aware Package Selection, before the command is handed to the Daml Engine for interpretation.
Type: timer
Qualification: Latency
daml.participant.api.commands.taps_passes
Summary: The number of TAPS passes during processing of a command.
Description: The number of Topology-Aware Package Selection passes during processing of a command.
Type: histogram
Qualification: Debug
daml.participant.api.commands.valid_submissions
Summary: The total number of the valid Daml commands.
Description: The total number of the Daml commands that have passed validation and were sent to interpretation in this ledger api server process.
Type: meter
Qualification: Debug
daml.participant.api.commands.validation
Summary: The time to validate a Daml command.
Description: The time to validate a submitted Daml command before is fed to the interpreter.
Type: timer
Qualification: Debug
daml.participant.api.contract_store.lookup_batched
Summary: The time to execute batched contract lookup.
Description: The time to enqueue and execute batched contract lookup.
Type: timer
Qualification: Debug
daml.participant.api.contract_store.lookup_batched_contract_ids
Summary: The time to execute batched contract id lookup.
Description: The time to enqueue and execute batched contract id lookup.
Type: timer
Qualification: Debug
daml.participant.api.contract_store.lookup_batched_internal_ids
Summary: The time to execute batched internal id lookup.
Description: The time to enqueue and execute batched internal id lookup.
Type: timer
Qualification: Debug
daml.participant.api.contract_store.lookup_persisted
Summary: The time to lookup persisted contract by LF contract id.
Description: The time to enqueue and execute the lookup for persisted contract by LF contract id.
Type: timer
Qualification: Debug
daml.participant.api.execution.cache.contract_state.register_update
Summary: The time spent to update the contract state cache.
Description: The total time spent in sequential update steps of the contract state caches updating logic. This metric is created with debugging purposes in mind.
Type: timer
Qualification: Debug
daml.participant.api.execution.cache.key_state.register_update
Summary: The time spent to update the key state cache.
Description: The total time spent in sequential update steps of the key state caches updating logic. This metric is created with debugging purposes in mind.
Type: timer
Qualification: Debug
daml.participant.api.execution.engine
Summary: The time spent executing a Daml command.
Description: The time spent by the Daml engine executing a Daml command (excluding fetching data).
Type: timer
Qualification: Debug
daml.participant.api.execution.engine_running
Summary: The number of Daml commands currently being executed.
Description: The number of the commands that are currently being executed by the Daml engine (excluding fetching data).
Type: counter
Qualification: Debug
daml.participant.api.execution.get_lf_package
Summary: The time to fetch individual Daml code packages during interpretation.
Description: The interpretation of a command in the ledger api server might require fetching multiple Daml packages. This metric exposes the time needed to fetch the packages that are necessary for interpretation.
Type: timer
Qualification: Debug
daml.participant.api.execution.lookup_active_contract
Summary: The time to lookup individual active contracts during interpretation.
Description: The interpretation of a command in the ledger api server might require fetching multiple active contracts. This metric exposes the time to lookup individual active contracts.
Type: timer
Qualification: Debug
daml.participant.api.execution.lookup_active_contract_count_per_execution
Summary: The number of the active contracts looked up per Daml command.
Description: The interpretation of a command in the ledger api server might require fetching multiple active contracts. This metric exposes the number of active contracts that must be looked up to process a Daml command.
Type: histogram
Qualification: Debug
daml.participant.api.execution.lookup_active_contract_per_execution
Summary: The compound time to lookup all active contracts in a single Daml command.
Description: The interpretation of a command in the ledger api server might require fetching multiple active contracts. This metric exposes the compound time to lookup all the active contracts in a single Daml command.
Type: timer
Qualification: Debug
daml.participant.api.execution.lookup_contract_key
Summary: The time to lookup individual contract keys during interpretation.
Description: The interpretation of a command in the ledger api server might require fetching multiple contract keys. This metric exposes the time needed to lookup individual contract keys.
Type: timer
Qualification: Debug
daml.participant.api.execution.lookup_contract_key_count_per_execution
Summary: The number of contract keys looked up per Daml command.
Description: The interpretation of a command in the ledger api server might require fetching multiple contract keys. This metric exposes the number of contract keys that must be looked up to process a Daml command.
Type: histogram
Qualification: Debug
daml.participant.api.execution.lookup_contract_key_per_execution
Summary: The compound time to lookup all contract keys in a single Daml command.
Description: The interpretation of a command in the ledger api server might require fetching multiple contract keys. This metric exposes the compound time needed to lookup all the contract keys in a single Daml command.
Type: timer
Qualification: Debug
daml.participant.api.execution.retry
Summary: The number of the interpretation retries.
Description: The total number of interpretation retries attempted due to mismatching ledger effective time in this ledger api server process.
Type: meter
Qualification: Debug
daml.participant.api.execution.total
Summary: The overall time spent interpreting a Daml command.
Description: The time spent interpreting a Daml command in the ledger api server (includes executing Daml and fetching data).
Type: timer
Qualification: Debug
daml.participant.api.execution.total_running
Summary: The number of Daml commands currently being interpreted.
Description: The number of the commands that are currently being interpreted (includes executing Daml code and fetching data).
Type: counter
Qualification: Debug
daml.participant.api.index.active_contracts_buffer_size
Summary: The buffer size for active contracts requests.
Description: An Pekko stream buffer is added at the end of all streaming queries, allowing to absorb temporary downstream backpressure (e.g. when the client is slower than upstream delivery throughput). This metric gauges the size of the buffer for queries requesting active contracts that transactions satisfying a given predicate.
Type: counter
Qualification: Debug
daml.participant.api.index.completions_buffer_size
Summary: The buffer size for completions requests.
Description: An Pekko stream buffer is added at the end of all streaming queries, allowing to absorb temporary downstream backpressure (e.g. when the client is slower than upstream delivery throughput). This metric gauges the size of the buffer for queries requesting the completed commands in a specific period of time.
Type: counter
Qualification: Debug
daml.participant.api.index.db.active_contract_keys_lookup.batch.batch_size
Summary: The batch sizes in the lookup batch-loading Contract Service.
Description: The number of lookups contained in a batch, used in the batch-loading Contract Service.
Type: histogram
Qualification: Debug
daml.participant.api.index.db.active_contract_keys_lookup.batch.buffer_capacity
Summary: The capacity of the lookup queue.
Description: The maximum number of elements that can be kept in the queue of lookups in the batch-loading queue of the Contract Service.
Type: counter
Qualification: Debug
daml.participant.api.index.db.active_contract_keys_lookup.batch.buffer_delay
Summary: The queuing delay for the lookup queue.
Description: The queuing delay for the pending lookups in the batch-loading queue of the Contract Service.
Type: timer
Qualification: Debug
daml.participant.api.index.db.active_contract_keys_lookup.batch.buffer_length
Summary: The number of the currently pending lookups.
Description: The number of the currently pending lookups in the batch-loading queue of the Contract Service.
Type: counter
Qualification: Debug
daml.participant.api.index.db.active_contract_lookup.batch.batch_size
Summary: The batch sizes in the lookup batch-loading Contract Service.
Description: The number of lookups contained in a batch, used in the batch-loading Contract Service.
Type: histogram
Qualification: Debug
daml.participant.api.index.db.active_contract_lookup.batch.buffer_capacity
Summary: The capacity of the lookup queue.
Description: The maximum number of elements that can be kept in the queue of lookups in the batch-loading queue of the Contract Service.
Type: counter
Qualification: Debug
daml.participant.api.index.db.active_contract_lookup.batch.buffer_delay
Summary: The queuing delay for the lookup queue.
Description: The queuing delay for the pending lookups in the batch-loading queue of the Contract Service.
Type: timer
Qualification: Debug
daml.participant.api.index.db.active_contract_lookup.batch.buffer_length
Summary: The number of the currently pending lookups.
Description: The number of the currently pending lookups in the batch-loading queue of the Contract Service.
Type: counter
Qualification: Debug
daml.participant.api.index.db.flat_transactions_stream.translation
Summary: The time needed to turn serialized Daml-LF values into in-memory objects.
Description: Some index database queries that target contracts and transactions involve a Daml-LF translation step. For such queries this metric stands for the time it takes to turn the serialized Daml-LF values into in-memory representation.
Type: timer
Qualification: Debug
daml.participant.api.index.db.lookup_active_contract
Summary: The time spent fetching a contract using its id.
Description: This metric exposes the time spent fetching a contract using its id from the index db. It is then used by the Daml interpreter when evaluating a command into a transaction.
Type: timer
Qualification: Debug
daml.participant.api.index.db.lookup_key
Summary: The time spent looking up a contract using its key.
Description: This metric exposes the time spent looking up a contract using its key in the index db. It is then used by the Daml interpreter when evaluating a command into a transaction.
Type: timer
Qualification: Debug
daml.participant.api.index.db.tree_transactions_stream.translation
Summary: The time needed to turn serialized Daml-LF values into in-memory objects.
Description: Some index database queries that target contracts and transactions involve a Daml-LF translation step. For such queries this metric stands for the time it takes to turn the serialized Daml-LF values into in-memory representation.
Type: timer
Qualification: Debug
daml.participant.api.index.ledger_end_sequential_id
Summary: The sequential id of the current ledger end kept in memory.
Description: The ledger end’s sequential id is a monotonically increasing integer value representing the sequential id ascribed to the most recent ledger event ingested by the index db. Please note, that only a subset of all ledger events are ingested and given a sequential id. These are: creates, consuming exercises, non-consuming exercises and divulgence events. This value can be treated as a counter of all such events visible to a given participant. This metric exposes the latest ledger end’s sequential id registered in the in-memory data set.
Type: gauge
Qualification: Debug
daml.participant.api.index.transaction_trees_buffer_size
Summary: The buffer size for transaction trees requests.
Description: An Pekko stream buffer is added at the end of all streaming queries, allowing to absorb temporary downstream backpressure (e.g. when the client is slower than upstream delivery throughput). This metric gauges the size of the buffer for queries requesting transaction trees.
Type: counter
Qualification: Debug
daml.participant.api.index.updates_buffer_size
Summary: The buffer size for streaming updates requests.
Description: An Pekko stream buffer is added at the end of all streaming queries, allowing to absorb temporary downstream backpressure (e.g. when the client is slower than upstream delivery throughput). This metric gauges the size of the buffer for queries requesting updates in a specific period of time that satisfy a given predicate.
Type: counter
Qualification: Debug
daml.participant.api.indexer.deactivation_distances
Summary: Event sequence id distances between activations and deactivations.
Description: Histogram to collect the statistics of how long individual contracts lived.
Type: histogram
Qualification: Debug
daml.participant.api.indexer.events*
Summary: Number of ledger events processed.
Description: Represents the total number of ledger events processed (transactions, reassignments, party allocations).
Type: meter
Qualification: Debug
- Labels:
participant_id: The id of the participant.
user_id: The user generating the events.
event_type: The type of ledger event processed (transaction, reassignment, party_allocation).
status: Indicates if the event was accepted or not. Possible values accepted|rejected.
daml.participant.api.indexer.indexer_queue_blocked
Summary: The amount of blocked enqueue operations for the indexer queue.
Description: Indexer queue exerts backpressure by blocking asynchronous enqueue operations. This meter measures the amount of such blocked operations, signalling backpressure materializing from downstream.
Type: meter
Qualification: Debug
daml.participant.api.indexer.indexer_queue_buffered
Summary: The size of the buffer before the indexer.
Description: This buffer is located before the indexer, increasing amount signals backpressure mounting.
Type: meter
Qualification: Debug
daml.participant.api.indexer.indexer_queue_uncommitted
Summary: The amount of entries which are uncommitted for the indexer.
Description: Uncommitted entries contain all blocked, buffered and submitted, but not yet committed entries. This amount signals the momentum of stream processing, and has a theoretical maximum defined by all the queue perameters.
Type: meter
Qualification: Debug
daml.participant.api.indexer.ledger_end_sequential_id
Summary: The sequential id of the current ledger end kept in the database.
Description: The ledger end’s sequential id is a monotonically increasing integer value representing the sequential id ascribed to the most recent ledger event ingested by the index db. Please note, that only a subset of all ledger events are ingested and given a sequential id. These are: creates, consuming exercises, non-consuming exercises and divulgence events. This value can be treated as a counter of all such events visible to a given participant. This metric exposes the latest ledger end’s sequential id registered in the database.
Type: gauge
Qualification: Debug
daml.participant.api.indexer.metered_events*
Summary: Number of individual ledger events (create, exercise, archive).
Description: Represents the number of individual ledger events constituting a transaction.
Type: meter
Qualification: Debug
- Labels:
participant_id: The id of the participant.
user_id: The user generating the events.
daml.participant.api.indexer.output_batched_buffer_length
Summary: The size of the queue between the indexer and the in-memory state updating flow.
Description: This counter counts batches of updates passed to the in-memory flow. Batches are dynamically-sized based on amount of backpressure exerted by the downstream stages of the flow.
Type: counter
Qualification: Debug
daml.participant.api.indexer.updates
Summary: The number of the state updates persisted to the database.
Description: The number of the state updates persisted to the database. There are updates such as accepted transactions, configuration changes, party allocations, rejections, etc, but they also include synthetic events when the node learned about the sequencer clock advancing without any actual ledger event such as due to submission receipts or time proofs.
Type: counter
Qualification: Traffic
daml.participant.api.lapi.streams.acs_sent
Summary: The number of the active contracts sent by the ledger api.
Description: The total number of active contracts sent over the ledger api streams to all clients.
Type: counter
Qualification: Traffic
daml.participant.api.lapi.streams.completions_sent
Summary: The number of the command completions sent by the ledger api.
Description: The total number of completions sent over the ledger api streams to all clients.
Type: counter
Qualification: Traffic
daml.participant.api.lapi.streams.transaction_trees_sent
Summary: The number of the transaction trees sent over the ledger api.
Description: The total number of the transaction trees sent over the ledger api streams to all clients.
Type: counter
Qualification: Traffic
daml.participant.api.lapi.streams.updates_sent
Summary: The number of the flat updates sent over the ledger api.
Description: The total number of the flat updates sent over the ledger api streams to all clients.
Type: counter
Qualification: Traffic
daml.participant.api.services.current_ledger_end
Summary: The time to execute an index service operation.
Description: The index service is an internal component responsible for access to the index db data. Its operations are invoked whenever a client request received over the ledger api requires access to the index db. This metric captures time statistics of such operations.
Type: timer
Qualification: Debug
daml.participant.api.services.get_active_contracts
Summary: The time to execute an index service operation.
Description: The index service is an internal component responsible for access to the index db data. Its operations are invoked whenever a client request received over the ledger api requires access to the index db. This metric captures time statistics of such operations.
Type: timer
Qualification: Debug
daml.participant.api.services.get_completions
Summary: The time to execute an index service operation.
Description: The index service is an internal component responsible for access to the index db data. Its operations are invoked whenever a client request received over the ledger api requires access to the index db. This metric captures time statistics of such operations.
Type: timer
Qualification: Debug
daml.participant.api.services.get_events_by_contract_id
Summary: The time to execute an index service operation.
Description: The index service is an internal component responsible for access to the index db data. Its operations are invoked whenever a client request received over the ledger api requires access to the index db. This metric captures time statistics of such operations.
Type: timer
Qualification: Debug
daml.participant.api.services.get_lf_archive
Summary: The time to execute an index service operation.
Description: The index service is an internal component responsible for access to the index db data. Its operations are invoked whenever a client request received over the ledger api requires access to the index db. This metric captures time statistics of such operations.
Type: timer
Qualification: Debug
daml.participant.api.services.get_participant_id
Summary: The time to execute an index service operation.
Description: The index service is an internal component responsible for access to the index db data. Its operations are invoked whenever a client request received over the ledger api requires access to the index db. This metric captures time statistics of such operations.
Type: timer
Qualification: Debug
daml.participant.api.services.get_parties
Summary: The time to execute an index service operation.
Description: The index service is an internal component responsible for access to the index db data. Its operations are invoked whenever a client request received over the ledger api requires access to the index db. This metric captures time statistics of such operations.
Type: timer
Qualification: Debug
daml.participant.api.services.get_update_by_id
Summary: The time to execute an index service operation.
Description: The index service is an internal component responsible for access to the index db data. Its operations are invoked whenever a client request received over the ledger api requires access to the index db. This metric captures time statistics of such operations.
Type: timer
Qualification: Debug
daml.participant.api.services.get_update_by_offset
Summary: The time to execute an index service operation.
Description: The index service is an internal component responsible for access to the index db data. Its operations are invoked whenever a client request received over the ledger api requires access to the index db. This metric captures time statistics of such operations.
Type: timer
Qualification: Debug
daml.participant.api.services.index.in_memory_fan_out_buffer.prune
Summary: The time to remove all elements from the in-memory fan-out buffer.
Description: It is possible to remove the oldest entries of the in-memory fan out buffer. This metric exposes the time needed to prune the buffer.
Type: timer
Qualification: Debug
daml.participant.api.services.index.in_memory_fan_out_buffer.push
Summary: The time to add a new event into the buffer.
Description: The in-memory fan-out buffer is a buffer that stores the last ingested maxBufferSize accepted and rejected submission updates as TransactionLogUpdate. It allows bypassing IndexDB persistence fetches for recent updates for flat and transaction tree streams, command completion streams and by-event-id and by-transaction-id flat and transaction tree lookups. This metric exposes the time spent on adding a new event into the buffer.
Type: timer
Qualification: Debug
daml.participant.api.services.index.in_memory_fan_out_buffer.size
Summary: The size of the in-memory fan-out buffer.
Description: The actual size of the in-memory fan-out buffer. This metric is mostly targeted for debugging purposes.
Type: histogram
Qualification: Saturation
daml.participant.api.services.index.write.allocate_party
Summary: The time to execute a write service operation.
Description: The write service is an internal interface for changing the state through the synchronization services. The methods in this interface are all methods that are supported uniformly across all ledger implementations. This metric exposes the time needed to execute each operation.
Type: timer
Qualification: Debug
daml.participant.api.services.index.write.prune
Summary: The time to execute a write service operation.
Description: The write service is an internal interface for changing the state through the synchronization services. The methods in this interface are all methods that are supported uniformly across all ledger implementations. This metric exposes the time needed to execute each operation.
Type: timer
Qualification: Debug
daml.participant.api.services.index.write.submit_reassignment
Summary: The time to execute a write service operation.
Description: The write service is an internal interface for changing the state through the synchronization services. The methods in this interface are all methods that are supported uniformly across all ledger implementations. This metric exposes the time needed to execute each operation.
Type: timer
Qualification: Debug
daml.participant.api.services.index.write.submit_reassignment_running
Summary: The time to execute a write service operation.
Description: The write service is an internal interface for changing the state through the synchronization services. The methods in this interface are all methods that are supported uniformly across all ledger implementations. This metric exposes the time needed to execute each operation.
Type: counter
Qualification: Debug
daml.participant.api.services.index.write.submit_transaction
Summary: The time to execute a write service operation.
Description: The write service is an internal interface for changing the state through the synchronization services. The methods in this interface are all methods that are supported uniformly across all ledger implementations. This metric exposes the time needed to execute each operation.
Type: timer
Qualification: Debug
daml.participant.api.services.index.write.submit_transaction_running
Summary: The time to execute a write service operation.
Description: The write service is an internal interface for changing the state through the synchronization services. The methods in this interface are all methods that are supported uniformly across all ledger implementations. This metric exposes the time needed to execute each operation.
Type: counter
Qualification: Debug
daml.participant.api.services.index.write.update_vetted_packages
Summary: The time to execute a write service operation.
Description: The write service is an internal interface for changing the state through the synchronization services. The methods in this interface are all methods that are supported uniformly across all ledger implementations. This metric exposes the time needed to execute each operation.
Type: timer
Qualification: Debug
daml.participant.api.services.index.write.upload_packages
Summary: The time to execute a write service operation.
Description: The write service is an internal interface for changing the state through the synchronization services. The methods in this interface are all methods that are supported uniformly across all ledger implementations. This metric exposes the time needed to execute each operation.
Type: timer
Qualification: Debug
daml.participant.api.services.latest_pruned_offsets
Summary: The time to execute an index service operation.
Description: The index service is an internal component responsible for access to the index db data. Its operations are invoked whenever a client request received over the ledger api requires access to the index db. This metric captures time statistics of such operations.
Type: timer
Qualification: Debug
daml.participant.api.services.list_known_parties
Summary: The time to execute an index service operation.
Description: The index service is an internal component responsible for access to the index db data. Its operations are invoked whenever a client request received over the ledger api requires access to the index db. This metric captures time statistics of such operations.
Type: timer
Qualification: Debug
daml.participant.api.services.list_lf_packages
Summary: The time to execute an index service operation.
Description: The index service is an internal component responsible for access to the index db data. Its operations are invoked whenever a client request received over the ledger api requires access to the index db. This metric captures time statistics of such operations.
Type: timer
Qualification: Debug
daml.participant.api.services.lookup_active_contract
Summary: The time to execute an index service operation.
Description: The index service is an internal component responsible for access to the index db data. Its operations are invoked whenever a client request received over the ledger api requires access to the index db. This metric captures time statistics of such operations.
Type: timer
Qualification: Debug
daml.participant.api.services.lookup_configuration
Summary: The time to execute an index service operation.
Description: The index service is an internal component responsible for access to the index db data. Its operations are invoked whenever a client request received over the ledger api requires access to the index db. This metric captures time statistics of such operations.
Type: timer
Qualification: Debug
daml.participant.api.services.lookup_contract_key
Summary: The time to execute an index service operation.
Description: The index service is an internal component responsible for access to the index db data. Its operations are invoked whenever a client request received over the ledger api requires access to the index db. This metric captures time statistics of such operations.
Type: timer
Qualification: Debug
daml.participant.api.services.lookup_contract_state
Summary: The time to execute an index service operation.
Description: The index service is an internal component responsible for access to the index db data. Its operations are invoked whenever a client request received over the ledger api requires access to the index db. This metric captures time statistics of such operations.
Type: timer
Qualification: Debug
daml.participant.api.services.lookup_maximum_ledger_time
Summary: The time to execute an index service operation.
Description: The index service is an internal component responsible for access to the index db data. Its operations are invoked whenever a client request received over the ledger api requires access to the index db. This metric captures time statistics of such operations.
Type: timer
Qualification: Debug
daml.participant.api.services.party_entries
Summary: The time to execute an index service operation.
Description: The index service is an internal component responsible for access to the index db data. Its operations are invoked whenever a client request received over the ledger api requires access to the index db. This metric captures time statistics of such operations.
Type: timer
Qualification: Debug
daml.participant.api.services.prune
Summary: The time to execute an index service operation.
Description: The index service is an internal component responsible for access to the index db data. Its operations are invoked whenever a client request received over the ledger api requires access to the index db. This metric captures time statistics of such operations.
Type: timer
Qualification: Debug
daml.participant.api.services.pruning.prune.completed
Summary: Total number of completed pruning processes.
Description:
Type: meter
Qualification: Debug
daml.participant.api.services.pruning.prune.started
Summary: Total number of started pruning processes.
Description:
Type: meter
Qualification: Debug
daml.participant.api.services.read.compute_highest_ranked_synchronizer_from_admissible
Summary: The time to execute a read service operation.
Description: The read service is an internal interface for reading the events from the synchronization interfaces. The metrics expose the time needed to execute each operation.
Type: timer
Qualification: Debug
daml.participant.api.services.read.compute_party_vetting_map
Summary: The time to execute a read service operation.
Description: The read service is an internal interface for reading the events from the synchronization interfaces. The metrics expose the time needed to execute each operation.
Type: timer
Qualification: Debug
daml.participant.api.services.read.get_connected_synchronizers
Summary: The time to execute a read service operation.
Description: The read service is an internal interface for reading the events from the synchronization interfaces. The metrics expose the time needed to execute each operation.
Type: timer
Qualification: Debug
daml.participant.api.services.read.get_lf_archive
Summary: The time to execute a read service operation.
Description: The read service is an internal interface for reading the events from the synchronization interfaces. The metrics expose the time needed to execute each operation.
Type: timer
Qualification: Debug
daml.participant.api.services.read.incomplete_reassignment_offsets
Summary: The time to execute a read service operation.
Description: The read service is an internal interface for reading the events from the synchronization interfaces. The metrics expose the time needed to execute each operation.
Type: timer
Qualification: Debug
daml.participant.api.services.read.list_lf_packages
Summary: The time to execute a read service operation.
Description: The read service is an internal interface for reading the events from the synchronization interfaces. The metrics expose the time needed to execute each operation.
Type: timer
Qualification: Debug
daml.participant.api.services.read.list_vetted_packages
Summary: The time to execute a read service operation.
Description: The read service is an internal interface for reading the events from the synchronization interfaces. The metrics expose the time needed to execute each operation.
Type: timer
Qualification: Debug
daml.participant.api.services.read.select_routing_synchronizer
Summary: The time to execute a read service operation.
Description: The read service is an internal interface for reading the events from the synchronization interfaces. The metrics expose the time needed to execute each operation.
Type: timer
Qualification: Debug
daml.participant.api.services.read.state_updates
Summary: The time to execute a read service operation.
Description: The read service is an internal interface for reading the events from the synchronization interfaces. The metrics expose the time needed to execute each operation.
Type: timer
Qualification: Debug
daml.participant.api.services.read.validate_dar
Summary: The time to execute a read service operation.
Description: The read service is an internal interface for reading the events from the synchronization interfaces. The metrics expose the time needed to execute each operation.
Type: timer
Qualification: Debug
daml.participant.api.services.transaction_trees
Summary: The time to execute an index service operation.
Description: The index service is an internal component responsible for access to the index db data. Its operations are invoked whenever a client request received over the ledger api requires access to the index db. This metric captures time statistics of such operations.
Type: timer
Qualification: Debug
daml.participant.api.services.transactions
Summary: The time to execute an index service operation.
Description: The index service is an internal component responsible for access to the index db data. Its operations are invoked whenever a client request received over the ledger api requires access to the index db. This metric captures time statistics of such operations.
Type: timer
Qualification: Debug
daml.participant.console.tx-node-count
Summary: Number of nodes per transaction histogram, measured using canton console ledger_api.updates.start_measure
Description:
Type: histogram
Qualification: Debug
daml.participant.console.tx-nodes-emitted
Summary: Total number of nodes emitted, measured using canton console ledger_api.updates.start_measure
Description:
Type: meter
Qualification: Debug
daml.participant.console.tx-size
Summary: Transaction size histogram, measured using canton console ledger_api.updates.start_measure
Description:
Type: histogram
Qualification: Debug
daml.participant.declarative_api.errors
Summary: Errors for the last update
Description: The node will attempt to apply the changes configured in the declarative config file. A positive number means that some items failed to be synchronised. A negative number means that the overall synchronisation procedure failed with an error. : 0 = everything good, -1 = config file unreadable, -2 = context could not be created, -3 = failure while applying items, -9 = exception caught.
Type: gauge
Qualification: Errors
daml.participant.declarative_api.items
Summary: Number of items managed through the declarative API
Description: This metric indicates the number of items managed through the declarative API
Type: gauge
Qualification: Debug
daml.participant.inflight_validation_requests*
Summary: Number of requests being validated.
Description: Number of requests that are currently being validated. This also covers requests submitted by other participants.
Type: gauge
Qualification: Saturation
- Labels:
participant: The id of the participant for which the value applies.
daml.participant.sync.commitments.catchup-mode-enabled
Summary: Measures how many times the commitment processor catch-up mode has been triggered.
Description: Participant nodes compute bilateral commitments at regular intervals. This metric exposes how often the catch-up mode has been activated. The catch-up mode is triggered according to catch-up config and happens if the participant lags behind on computation. A healthy value is 0. An increasing value indicates intermittent periods when a participant alternates between healthy and struggling to keep up with commitment computation. However, we do not see a constantly increasing value for a participant that is consistently behind commitment computation because, once catch-up mode is activated, the participant remains in catch-up mode until it has completely caught up, and only triggers the metric once. In order to troubleshoot non-zero values, the operator should cross-correlate this value with the daml.participant.sync.commitments.compute metric.
Type: meter
Qualification: Debug
daml.participant.sync.commitments.compute
Summary: Measures the time that the participant node spends computing commitments.
Description: Participant nodes compute bilateral commitments at regular intervals, i.e., reconciliation intervals. This metric exposes the time spent on each computation in milliseconds. There are two cases that the operator should pay attention to. First, fluctuations in this value are expected if the number of counter-participants or common stakeholder groups changes. However, changes with no apparent reason could indicate a bug and the operator should monitor closely. Second, it is a cause of concern if the value starts approaching or is greater than the reconciliation interval: The participant will perpetually lag behind, because it needs to compute commitments more frequently than it can manage. The operator should consider asking the synchronizer operator to increase the reconciliation interval if the increase in commitment computation is expected, or otherwise investigate the cause.
Type: timer
Qualification: Debug
daml.participant.sync.commitments.last-incoming-processed
Summary: Timestamp of the latest processed incoming ACS commitment period end in microseconds since unix epoch
Description: Timestamp of the latest incoming ACS commitment period end that was fully processed by the participant.
Type: gauge
Qualification: Latency
daml.participant.sync.commitments.last-incoming-received
Summary: Timestamp of the latest received incoming ACS commitment period end in microseconds since unix epoch
Description: Timestamp of the latest incoming ACS commitment period end that has been received and enqueued, but not yet processed by the participant. To measure the latency of particular counter participants, use one of the counter-participant-latency metrics.
Type: gauge
Qualification: Latency
daml.participant.sync.commitments.last-locally-checkpointed
Summary: Record time of the latest checkpointed ACS commitment in microseconds since unix epoch
Description: Timestamp of the latest checkpointed ACS commitment in microseconds. Crash recovery will start reingesting from this timestamp on or from the latest locally completed ACS commitment interval on, whichever is later.
Type: gauge
Qualification: Latency
daml.participant.sync.commitments.last-locally-completed
Summary: Timestamp of the latest locally completed ACS commitment interval in microseconds since unix epoch
Description: Timestamp of the latest locally completed ACS commitment interval. Crash recovery will start reingesting from this timestamp on or from the latest checkpointed ACS commitment interval on, whichever is later.
Type: gauge
Qualification: Latency
daml.participant.sync.commitments.sequencing-time
Summary: Measures the time between the end of a commitment period, and the time when the sequencer observes the corresponding commitment.
Description: Participant nodes compute bilateral commitments at regular intervals. After a participant computes a commitment, it sends it for sequencing. The time between the end of a commitment interval and sequencing is measured in milliseconds. Because commitment computation is comprised within the measured time, the value is always greater than the daml.participant.sync.commitments.compute metric. The operator should pay attention to fluctuations of this value. An increase can be expected, e.g., because the computation time increases. However, a value increase can be a cause of concern, because it can indicate that the participant is lagging behind in processing messages and computing commitments, which is accompanied by ACS_COMMITMENT_DEGRADATION warnings in the participant logs. An increase can also indicate that the sequencer is slow in sequencing the commitment messages. The operator should cross-correlate with sequencing metrics such as daml.sequencer-client.submissions.sequencing and daml.sequencer-client.handler.delay. In this case, the operator should consider changing the preferred sequencer configuration.
Type: gauge
Qualification: Debug
daml.participant.sync.commitments.synchronizer.largest-counter-participant-latency
Summary: The highest latency in micros for commitments outstanding from counter-participants for more than a threshold-number of reconciliation intervals.
Description: Participant nodes compute bilateral commitments at regular intervals and send them. This metric is the default indicator of a counter-participant being slow.The metric exposes the highest latency of a counter-participant, measured by subtracting the highest known counter-participant latency from the most recent period processed by the participant. A counter-participant has to send a commitment at least once in order to appear here. The operator of a participant can configure a default threshold per synchronizer that the participant connects to. The smaller the threshold, the more sensitive the metric is to even small delays in receiving commitments from counter-participants. For example, for a threshold of 5 intervals and a reconciliation interval of 1 minute, the metric measures the latency of counter-participants that have sent no commitments for periods covering the last 5 minutes observed by the participant.
Type: gauge
Qualification: Debug
daml.participant.sync.commitments.synchronizer.largest-distinguished-counter-participant-latency
Summary: The highest latency in micros for commitments outstanding from distinguished counter-participants for more than a threshold-number of reconciliation intervals.
Description: Participant nodes compute bilateral commitments at regular intervals and send them. This metric indicates that a distinguished counter-participant is slow, i.e., the participant cannot confirm that its state is the same with that of a counter-participant with whom the operator has an important business relation.The metric exposes the highest latency of a counter-participant, measured by subtracting the highest known counter-participant latency from the most recent period processed by the participant. A counter-participant has to send a commitment at least once in order to appear here. The operator of a participant can configure a default threshold per synchronizer that the participant connects to. The smaller the threshold, the more sensitive the metric is to even small delays in receiving commitments from counter-participants. For example, for a threshold of 5 intervals and a reconciliation interval of 1 minute, the metric measures the latency of counter-participants that have sent no commitments for periods covering the last 5 minutes observed by the participant.
Type: gauge
Qualification: Debug
daml.participant.sync.conflict-detection.sequencer-counter-queue
Summary: Size of conflict detection sequencer counter queue
Description: The task scheduler will work off tasks according to the timestamp order, scheduling the tasks whenever a new timestamp has been observed. This metric exposes the number of un-processed sequencer messages that will trigger a timestamp advancement.
Type: counter
Qualification: Debug
daml.participant.sync.in-flight-submission-synchronizer-tracker.unsequenced-in-flight-submissions
Summary: Number of unsequenced submissions in-flight.
Description: Number of unsequenced submissions in-flight. Unsequenced in-flight submissions are tracked in-memory, so high amount here will boil down to memory pressure.
Type: gauge
Qualification: Saturation
daml.participant.sync.inflight-validations
Summary: Number of requests being validated on the synchronizer.
Description: Number of requests that are currently being validated on the synchronizer. This also covers requests submitted by other participants.
Type: counter
Qualification: Saturation
daml.participant.sync.protocol-messages.confirmation-request-creation
Summary: Time to create a transaction confirmation request
Description: The time that the transaction protocol processor needs to create a transaction confirmation request.
Type: timer
Qualification: Latency
daml.participant.sync.protocol-messages.confirmation-request-size
Summary: Confirmation request size
Description: Records the histogram of the sizes of (transaction) confirmation requests.
Type: histogram
Qualification: Debug
daml.participant.sync.protocol-messages.transaction-message-receipt
Summary: Time to parse and decrypt a transaction message
Description: The time that the transaction protocol processor needs to parse and decrypt an incoming confirmation request.
Type: timer
Qualification: Debug
daml.participant.sync.request-tracker.sequencer-counter-queue
Summary: Size of record order publisher sequencer counter queue
Description: Same as for conflict-detection, but measuring the sequencer counter queues for the publishing to the ledger api server according to record time.
Type: counter
Qualification: Debug
daml.pruning
Summary: Duration of prune operations.
Description: This timer exposes the duration of pruning requests from the Canton portion of the ledger.
Type: timer
Qualification: Saturation
daml.pruning.max-event-age
Summary: Age of oldest unpruned event.
Description: This gauge exposes the age of the oldest, unpruned event in hours as a way to quantify the pruning backlog.
Type: gauge
Qualification: Saturation
daml.sequencer-client.handler.actual-in-flight-event-batches
Summary: Nodes process the events from the synchronizer’s sequencer in batches. This metric tracks how many such batches are processed in parallel.
Description: Incoming messages are processed by a sequencer client, which combines them into batches of size up to ‘event-inbox-size’ before sending them to an application handler for processing. Depending on the system’s configuration, the rate at which event batches are sent to the handler may be throttled to avoid overwhelming it with too many events at once. Indicators that the configured upper bound may be too low: This metric constantly is close to the configured maximum, which is exposed via ‘max-in-flight-event-batches’, while the system’s resources are under-utilized. Indicators that the configured upper bound may be too high: Out-of-memory errors crashing the JVM or frequent garbage collection cycles that slow down processing. The metric tracks how many of these batches have been sent to the application handler but have not yet been fully processed. This metric can help identify potential bottlenecks or issues with the application’s processing of events and provide insights into the overall workload of the system.
Type: counter
Qualification: Saturation
daml.sequencer-client.handler.application-handle
Summary: Timer monitoring time and rate of sequentially handling the event application logic
Description: All events are received sequentially. This handler records the rate and time it takes the application (participant or mediator) to handle the events.
Type: timer
Qualification: Debug
daml.sequencer-client.handler.delay
Summary: The delay on the event processing in milliseconds
Description: Every message received from the sequencer carries a timestamp that was assigned by the sequencer when it sequenced the message. This timestamp is called the sequencing timestamp. The component receiving the message on the participant or mediator is the sequencer client, while on the block sequencer itself, it’s the block update generator. Upon having received the same message from enough sequencers (as configured by the trust threshold), the sequencer client compares the time difference between the sequencing time and the computers local clock and exposes this difference as the given metric. The difference will include the clock-skew and the processing latency between assigning the timestamp on the sequencer and receiving the message by the recipient from enough sequencers. If the difference is large compared to the usual latencies, clock skew can be ruled out, and enough sequencers are not slow, then it means that the node is still trying to catch up with events that the sequencers sequenced a while ago. This can happen after having been offline for a while or if the node is too slow to keep up with the messaging load.
Type: gauge
Qualification: Debug
daml.sequencer-client.handler.last-sequencing-time-micros
Summary: The sequencing time of the last processed event in microseconds since unix epoch
Description: Every message received from the sequencer carries a timestamp that was assigned by the sequencer when it sequenced the message. This timestamp is called the sequencing timestamp. The component receiving the message on the participant or mediator is the sequencer client, while on the block sequencer itself, it’s the block update generator. Upon having received the same message from enough sequencers (as configured by the trust threshold), this metric is updated with the sequencing time of that message.
Type: gauge
Qualification: Debug
daml.sequencer-client.handler.max-in-flight-event-batches
Summary: Nodes process the events from the synchronizer’s sequencer in batches. This metric tracks the upper bound of such batches being processed in parallel.
Description: Incoming messages are processed by a sequencer client, which combines them into batches of size up to ‘event-inbox-size’ before sending them to an application handler for processing. Depending on the system’s configuration, the rate at which event batches are sent to the handler may be throttled to avoid overwhelming it with too many events at once. Configured by ‘maximum-in-flight-event-batches’ parameter in the sequencer-client config The metric shows the configured upper limit on how many batches the application handler may process concurrently. The metric ‘actual-in-flight-event-batches’ tracks the actual number of currently processed batches.
Type: gauge
Qualification: Debug
daml.sequencer-client.handler.sequencer-events
Summary: Number of received events from the sequencer
Description: A participant reads events from the sequencer. This metric captures the count and rate of events.
Type: counter
Qualification: Debug
daml.sequencer-client.sequencer-connection-pool.active-subscriptions
Summary: Number of active subscriptions in the subscription pool
Description: This metric indicates the current number of subscriptions that are active.
Type: gauge
Qualification: Saturation
daml.sequencer-client.sequencer-connection-pool.grpc-requests
Summary: Number of gRPC requests sent on this connection
Description: This metric indicates the number of gRPC requests that have been sent on this connection.
Type: counter
Qualification: Saturation
daml.sequencer-client.sequencer-connection-pool.subscription-threshold
Summary: Sum of trust threshold and liveness margin configured in the subscription pool
Description: The liveness margin determines how many subscriptions on different sequencers are continuously maintained, beyond the minimum number defined by the trust threshold. In other words, the subscription pool will strive to maintain at all times (trust threshold + liveness margin)-many subscriptions active. This provides tolerance to subscriptions falling, enabling the node to continue operating while some sequencers are down.
Type: gauge
Qualification: Saturation
daml.sequencer-client.sequencer-connection-pool.tracked-connections
Summary: Number of connections tracked by the connection pool
Description: The configuration of the connection pool defines the parameters of the sequencer connections. This metrics shows the current number of those connections.
Type: gauge
Qualification: Saturation
daml.sequencer-client.sequencer-connection-pool.trust-threshold
Summary: Trust threshold configured in the connection pool
Description: The trust threshold determines how many connections to sequencers must be available and consistent (same synchronizer ID, same protocol version, same static parameters) for the connection pool to initialize. Furthermore, it also determines the number of sequencer subscriptions that must deliver identical copies of an event for that event to be accepted and processed by the node.
Type: gauge
Qualification: Saturation
daml.sequencer-client.sequencer-connection-pool.validated-connections
Summary: Number of connections validated by the connection pool
Description: This metric indicates the current number of connections that are up and validated. These connections are available for components of the node that need to communicate with the synchronizer.
Type: gauge
Qualification: Saturation
daml.sequencer-client.submissions.amplification
Summary: Rate and timings of submission request attempts to a sequencer
Description: This timer is started when a submission request attempt is sent to the sequencer, and completed when it is observed as sequenced. If the attempt is not observed as sequenced before the amplification patience expires, no timing will be recorded for this and the following attempts.
Type: timer
Qualification: Latency
daml.sequencer-client.submissions.amplified-attempts
Summary: Count of send request attempts which are amplified
Description: Counter that is incremented if a send request attempt, which did not receive a synchronous error from the sequencer, is not observed as sequenced until the amplification patience expires and a new attempt is sent.
Type: meter
Qualification: Errors
daml.sequencer-client.submissions.attempt-sync-errors
Summary: Count of send request attempts which receive a synchronous error
Description: Counter that is incremented if a send request attempt receives a synchronous error from the sequencer.
Type: meter
Qualification: Errors
daml.sequencer-client.submissions.dropped
Summary: Count of send requests that did not cause an event to be sequenced
Description: Counter of send requests we did not witness a corresponding event to be sequenced by the supplied max-sequencing-time. There could be many reasons for this happening: the request may have been lost before reaching the sequencer, the sequencer may be at capacity and the the max-sequencing-time was exceeded by the time the request was processed, or the supplied max-sequencing-time may just be too small for the sequencer to be able to sequence the request.
Type: counter
Qualification: Errors
daml.sequencer-client.submissions.in-flight
Summary: Number of sequencer send requests we have that are waiting for an outcome or timeout
Description: Incremented on every successful send to the sequencer. Decremented when the event or an error is sequenced, or when the max-sequencing-time has elapsed.
Type: counter
Qualification: Debug
daml.sequencer-client.submissions.no-connection-available
Summary: Count of send attempts which are skipped because no connection is available
Description: Counter that is incremented if a send request attempt is skipped because there is no connection available.
Type: meter
Qualification: Errors
daml.sequencer-client.submissions.overloaded
Summary: Count of send requests which receive an overloaded response
Description: Counter that is incremented if a send request receives an overloaded response from the sequencer.
Type: counter
Qualification: Errors
daml.sequencer-client.submissions.sends
Summary: Rate and timings of send requests to the sequencer
Description: Provides a rate and time of how long it takes for send requests to be accepted by the sequencer. Note that this is just for the request to be made and not for the requested event to actually be sequenced.
Type: timer
Qualification: Debug
daml.sequencer-client.submissions.sequencing
Summary: Rate and timings of sequencing requests
Description: This timer is started when a submission is made to the sequencer and then completed when a corresponding event is witnessed from the sequencer, so will encompass the entire duration for the sequencer to sequence the request. If the request does not result in an event no timing will be recorded.
Type: timer
Qualification: Latency
daml.sequencer-client.traffic-control.event-delivered
Summary: Number of events that were sequenced and delivered.
Description: Counter for event-delivered-cost.
Type: counter
Qualification: Traffic
daml.sequencer-client.traffic-control.event-delivered-cost
Summary: Cost of events that were sequenced and delivered.
Description: Cost of events for which the sender received confirmation that they were delivered. There is an exception for aggregated submissions: the cost of aggregate events will be recorded as soon as the event is ordered and the sequencer waits to receive threshold-many events. The final event may or may not be delivered successfully depending on the result of the aggregation.
Type: meter
Qualification: Traffic
daml.sequencer-client.traffic-control.event-rejected
Summary: Number of events that were sequenced but not delivered.
Description: Counter for event-rejected-cost.
Type: counter
Qualification: Traffic
daml.sequencer-client.traffic-control.event-rejected-cost
Summary: Cost of events that were sequenced but no delivered successfully.
Description: Cost of events for which the sender received confirmation that the events will not be delivered. The reason for non-delivery is labeled on the metric, if available.
Type: meter
Qualification: Traffic
daml.sequencer-client.traffic-control.submitted-event-cost
Summary: Cost of event submitted from the sequencer client.
Description: When the sequencer client sends an event to the sequencer to be sequenced, it will record on this metric the cost of the event. Note that the event may or may not end up being sequenced. So this metric may not exactly match the actual consumed traffic.
Type: meter
Qualification: Traffic
Sequencer Metrics
daml.cache.evicted_weight
Summary: The sum of weights of cache entries evicted.
Description: The total weight of the entries evicted from the cache.
Type: counter
Qualification: Debug
daml.cache.evictions
Summary: The number of the evicted cache entries.
Description: When an entry is evicted from the cache, the counter is incremented.
Type: counter
Qualification: Debug
daml.cache.hits
Summary: The number of cache hits.
Description: When a cache lookup encounters an existing cache entry, the counter is incremented.
Type: counter
Qualification: Debug
daml.cache.misses
Summary: The number of cache misses.
Description: When a cache lookup first encounters a missing cache entry, the counter is incremented.
Type: counter
Qualification: Debug
daml.db-storage.general.executor.exectime
Summary: Execution time metric for database tasks
Description: The time a task is running on the database is measured using this metric.
Type: timer
Qualification: Debug
daml.db-storage.general.executor.load
Summary: Load of database pool
Description: Database queries run as tasks on an async executor. This metric shows the current number of queries running in parallel divided by the number database connections for this database connection pool.
Type: gauge
Qualification: Saturation
daml.db-storage.general.executor.queued
Summary: Number of database access tasks waiting in queue
Description: Database access tasks get scheduled in this queue and get executed using one of the existing asynchronous sessions. A large queue indicates that the database connection is not able to deal with the large number of requests. Note that the queue has a maximum size. Tasks that do not fit into the queue will be retried, but won’t show up in this metric.
Type: counter
Qualification: Saturation
daml.db-storage.general.executor.running
Summary: Number of database access tasks currently running
Description: Database access tasks run on an async executor. This metric shows the current number of tasks running in parallel.
Type: gauge
Qualification: Debug
daml.db-storage.general.executor.waittime
Summary: Scheduling time metric for database tasks
Description: Every database query is scheduled using an asynchronous executor with a queue. The time a task is waiting in this queue is monitored using this metric.
Type: timer
Qualification: Debug
daml.db-storage.write.executor.exectime
Summary: Execution time metric for database tasks
Description: The time a task is running on the database is measured using this metric.
Type: timer
Qualification: Debug
daml.db-storage.write.executor.load
Summary: Load of database pool
Description: Database queries run as tasks on an async executor. This metric shows the current number of queries running in parallel divided by the number database connections for this database connection pool.
Type: gauge
Qualification: Saturation
daml.db-storage.write.executor.queued
Summary: Number of database access tasks waiting in queue
Description: Database access tasks get scheduled in this queue and get executed using one of the existing asynchronous sessions. A large queue indicates that the database connection is not able to deal with the large number of requests. Note that the queue has a maximum size. Tasks that do not fit into the queue will be retried, but won’t show up in this metric.
Type: counter
Qualification: Saturation
daml.db-storage.write.executor.running
Summary: Number of database access tasks currently running
Description: Database access tasks run on an async executor. This metric shows the current number of tasks running in parallel.
Type: gauge
Qualification: Debug
daml.db-storage.write.executor.waittime
Summary: Scheduling time metric for database tasks
Description: Every database query is scheduled using an asynchronous executor with a queue. The time a task is waiting in this queue is monitored using this metric.
Type: timer
Qualification: Debug
daml.grpc.server
Summary: Distribution of the durations of serving gRPC requests.
Description:
Type: timer
Qualification: Latency
daml.grpc.server.handled
Summary: Total number of handled gRPC requests.
Description:
Type: meter
Qualification: Traffic
daml.grpc.server.messages.received
Summary: Total number of gRPC messages received (on either type of connection).
Description:
Type: meter
Qualification: Traffic
daml.grpc.server.messages.received.bytes
Summary: Distribution of payload sizes in gRPC messages received (both unary and streaming).
Description:
Type: histogram
Qualification: Traffic
daml.grpc.server.messages.sent
Summary: Total number of gRPC messages sent (on either type of connection).
Description:
Type: meter
Qualification: Traffic
daml.grpc.server.messages.sent.bytes
Summary: Distribution of payload sizes in gRPC messages sent (both unary and streaming).
Description:
Type: histogram
Qualification: Traffic
daml.grpc.server.requests.rejections*
Summary: Number of rejected requests due to active request limits.
Description: Counts the number of requests rejected because the active request limit was reached.
Type: counter
Qualification: Saturation
- Labels:
method: The method / service name limited.
service: The API the method belongs to
api: The API the method belongs to
daml.grpc.server.started
Summary: Total number of started gRPC requests (on either type of connection).
Description:
Type: meter
Qualification: Traffic
daml.sequencer-client.handler.actual-in-flight-event-batches
Summary: Nodes process the events from the synchronizer’s sequencer in batches. This metric tracks how many such batches are processed in parallel.
Description: Incoming messages are processed by a sequencer client, which combines them into batches of size up to ‘event-inbox-size’ before sending them to an application handler for processing. Depending on the system’s configuration, the rate at which event batches are sent to the handler may be throttled to avoid overwhelming it with too many events at once. Indicators that the configured upper bound may be too low: This metric constantly is close to the configured maximum, which is exposed via ‘max-in-flight-event-batches’, while the system’s resources are under-utilized. Indicators that the configured upper bound may be too high: Out-of-memory errors crashing the JVM or frequent garbage collection cycles that slow down processing. The metric tracks how many of these batches have been sent to the application handler but have not yet been fully processed. This metric can help identify potential bottlenecks or issues with the application’s processing of events and provide insights into the overall workload of the system.
Type: counter
Qualification: Saturation
daml.sequencer-client.handler.application-handle
Summary: Timer monitoring time and rate of sequentially handling the event application logic
Description: All events are received sequentially. This handler records the rate and time it takes the application (participant or mediator) to handle the events.
Type: timer
Qualification: Debug
daml.sequencer-client.handler.delay
Summary: The delay on the event processing in milliseconds
Description: Every message received from the sequencer carries a timestamp that was assigned by the sequencer when it sequenced the message. This timestamp is called the sequencing timestamp. The component receiving the message on the participant or mediator is the sequencer client, while on the block sequencer itself, it’s the block update generator. Upon having received the same message from enough sequencers (as configured by the trust threshold), the sequencer client compares the time difference between the sequencing time and the computers local clock and exposes this difference as the given metric. The difference will include the clock-skew and the processing latency between assigning the timestamp on the sequencer and receiving the message by the recipient from enough sequencers. If the difference is large compared to the usual latencies, clock skew can be ruled out, and enough sequencers are not slow, then it means that the node is still trying to catch up with events that the sequencers sequenced a while ago. This can happen after having been offline for a while or if the node is too slow to keep up with the messaging load.
Type: gauge
Qualification: Debug
daml.sequencer-client.handler.last-sequencing-time-micros
Summary: The sequencing time of the last processed event in microseconds since unix epoch
Description: Every message received from the sequencer carries a timestamp that was assigned by the sequencer when it sequenced the message. This timestamp is called the sequencing timestamp. The component receiving the message on the participant or mediator is the sequencer client, while on the block sequencer itself, it’s the block update generator. Upon having received the same message from enough sequencers (as configured by the trust threshold), this metric is updated with the sequencing time of that message.
Type: gauge
Qualification: Debug
daml.sequencer-client.handler.max-in-flight-event-batches
Summary: Nodes process the events from the synchronizer’s sequencer in batches. This metric tracks the upper bound of such batches being processed in parallel.
Description: Incoming messages are processed by a sequencer client, which combines them into batches of size up to ‘event-inbox-size’ before sending them to an application handler for processing. Depending on the system’s configuration, the rate at which event batches are sent to the handler may be throttled to avoid overwhelming it with too many events at once. Configured by ‘maximum-in-flight-event-batches’ parameter in the sequencer-client config The metric shows the configured upper limit on how many batches the application handler may process concurrently. The metric ‘actual-in-flight-event-batches’ tracks the actual number of currently processed batches.
Type: gauge
Qualification: Debug
daml.sequencer-client.handler.sequencer-events
Summary: Number of received events from the sequencer
Description: A participant reads events from the sequencer. This metric captures the count and rate of events.
Type: counter
Qualification: Debug
daml.sequencer-client.sequencer-connection-pool.active-subscriptions
Summary: Number of active subscriptions in the subscription pool
Description: This metric indicates the current number of subscriptions that are active.
Type: gauge
Qualification: Saturation
daml.sequencer-client.sequencer-connection-pool.grpc-requests
Summary: Number of gRPC requests sent on this connection
Description: This metric indicates the number of gRPC requests that have been sent on this connection.
Type: counter
Qualification: Saturation
daml.sequencer-client.sequencer-connection-pool.subscription-threshold
Summary: Sum of trust threshold and liveness margin configured in the subscription pool
Description: The liveness margin determines how many subscriptions on different sequencers are continuously maintained, beyond the minimum number defined by the trust threshold. In other words, the subscription pool will strive to maintain at all times (trust threshold + liveness margin)-many subscriptions active. This provides tolerance to subscriptions falling, enabling the node to continue operating while some sequencers are down.
Type: gauge
Qualification: Saturation
daml.sequencer-client.sequencer-connection-pool.tracked-connections
Summary: Number of connections tracked by the connection pool
Description: The configuration of the connection pool defines the parameters of the sequencer connections. This metrics shows the current number of those connections.
Type: gauge
Qualification: Saturation
daml.sequencer-client.sequencer-connection-pool.trust-threshold
Summary: Trust threshold configured in the connection pool
Description: The trust threshold determines how many connections to sequencers must be available and consistent (same synchronizer ID, same protocol version, same static parameters) for the connection pool to initialize. Furthermore, it also determines the number of sequencer subscriptions that must deliver identical copies of an event for that event to be accepted and processed by the node.
Type: gauge
Qualification: Saturation
daml.sequencer-client.sequencer-connection-pool.validated-connections
Summary: Number of connections validated by the connection pool
Description: This metric indicates the current number of connections that are up and validated. These connections are available for components of the node that need to communicate with the synchronizer.
Type: gauge
Qualification: Saturation
daml.sequencer-client.submissions.amplification
Summary: Rate and timings of submission request attempts to a sequencer
Description: This timer is started when a submission request attempt is sent to the sequencer, and completed when it is observed as sequenced. If the attempt is not observed as sequenced before the amplification patience expires, no timing will be recorded for this and the following attempts.
Type: timer
Qualification: Latency
daml.sequencer-client.submissions.amplified-attempts
Summary: Count of send request attempts which are amplified
Description: Counter that is incremented if a send request attempt, which did not receive a synchronous error from the sequencer, is not observed as sequenced until the amplification patience expires and a new attempt is sent.
Type: meter
Qualification: Errors
daml.sequencer-client.submissions.attempt-sync-errors
Summary: Count of send request attempts which receive a synchronous error
Description: Counter that is incremented if a send request attempt receives a synchronous error from the sequencer.
Type: meter
Qualification: Errors
daml.sequencer-client.submissions.dropped
Summary: Count of send requests that did not cause an event to be sequenced
Description: Counter of send requests we did not witness a corresponding event to be sequenced by the supplied max-sequencing-time. There could be many reasons for this happening: the request may have been lost before reaching the sequencer, the sequencer may be at capacity and the the max-sequencing-time was exceeded by the time the request was processed, or the supplied max-sequencing-time may just be too small for the sequencer to be able to sequence the request.
Type: counter
Qualification: Errors
daml.sequencer-client.submissions.in-flight
Summary: Number of sequencer send requests we have that are waiting for an outcome or timeout
Description: Incremented on every successful send to the sequencer. Decremented when the event or an error is sequenced, or when the max-sequencing-time has elapsed.
Type: counter
Qualification: Debug
daml.sequencer-client.submissions.no-connection-available
Summary: Count of send attempts which are skipped because no connection is available
Description: Counter that is incremented if a send request attempt is skipped because there is no connection available.
Type: meter
Qualification: Errors
daml.sequencer-client.submissions.overloaded
Summary: Count of send requests which receive an overloaded response
Description: Counter that is incremented if a send request receives an overloaded response from the sequencer.
Type: counter
Qualification: Errors
daml.sequencer-client.submissions.sends
Summary: Rate and timings of send requests to the sequencer
Description: Provides a rate and time of how long it takes for send requests to be accepted by the sequencer. Note that this is just for the request to be made and not for the requested event to actually be sequenced.
Type: timer
Qualification: Debug
daml.sequencer-client.submissions.sequencing
Summary: Rate and timings of sequencing requests
Description: This timer is started when a submission is made to the sequencer and then completed when a corresponding event is witnessed from the sequencer, so will encompass the entire duration for the sequencer to sequence the request. If the request does not result in an event no timing will be recorded.
Type: timer
Qualification: Latency
daml.sequencer-client.traffic-control.event-delivered
Summary: Number of events that were sequenced and delivered.
Description: Counter for event-delivered-cost.
Type: counter
Qualification: Traffic
daml.sequencer-client.traffic-control.event-delivered-cost
Summary: Cost of events that were sequenced and delivered.
Description: Cost of events for which the sender received confirmation that they were delivered. There is an exception for aggregated submissions: the cost of aggregate events will be recorded as soon as the event is ordered and the sequencer waits to receive threshold-many events. The final event may or may not be delivered successfully depending on the result of the aggregation.
Type: meter
Qualification: Traffic
daml.sequencer-client.traffic-control.event-rejected
Summary: Number of events that were sequenced but not delivered.
Description: Counter for event-rejected-cost.
Type: counter
Qualification: Traffic
daml.sequencer-client.traffic-control.event-rejected-cost
Summary: Cost of events that were sequenced but no delivered successfully.
Description: Cost of events for which the sender received confirmation that the events will not be delivered. The reason for non-delivery is labeled on the metric, if available.
Type: meter
Qualification: Traffic
daml.sequencer-client.traffic-control.submitted-event-cost
Summary: Cost of event submitted from the sequencer client.
Description: When the sequencer client sends an event to the sequencer to be sequenced, it will record on this metric the cost of the event. Note that the event may or may not end up being sequenced. So this metric may not exactly match the actual consumed traffic.
Type: meter
Qualification: Traffic
daml.sequencer.bftordering.consensus.commit-latency
Summary: Consensus commit latency
Description: Records the rate and latency it takes to commit a block at the consensus level.
Type: timer
Qualification: Latency
daml.sequencer.bftordering.consensus.discarded-messages
Summary: Discarded messages
Description: Discarded network messages received during an epoch, either due to being repeated (too many retransmissions), invalid or from a stale view
Type: meter
Qualification: Traffic
daml.sequencer.bftordering.consensus.discarded-rate-limited-retransmission-requests
Summary: Discarded rate limited retransmission requests
Description: Discarded retransmission requests messages due to rate limiting
Type: meter
Qualification: Traffic
daml.sequencer.bftordering.consensus.discarded-wrong-epoch-retransmission-responses
Summary: Discarded retransmission response messages
Description: Discarded retransmission response messages for epoch different than current one
Type: meter
Qualification: Traffic
daml.sequencer.bftordering.consensus.epoch
Summary: Epoch number
Description: Current epoch number for the node.
Type: gauge
Qualification: Traffic
daml.sequencer.bftordering.consensus.epoch-length
Summary: Epoch length
Description: Length of the current epoch in number of blocks.
Type: gauge
Qualification: Traffic
daml.sequencer.bftordering.consensus.epoch-view-changes
Summary: Number of view changes occurred
Description: Number of view changes occurred.
Type: gauge
Qualification: Latency
daml.sequencer.bftordering.consensus.incoming-retransmission-requests
Summary: Incoming retransmissions requests
Description: Retransmissions requests received during an epoch
Type: meter
Qualification: Traffic
daml.sequencer.bftordering.consensus.outgoing-retransmission-requests
Summary: Outgoing retransmissions requests
Description: Retransmissions requests sent during an epoch
Type: meter
Qualification: Traffic
daml.sequencer.bftordering.consensus.postponed-view-messages-dropped
Summary: Count of messages dropped by queue containing postponed view messages
Description: Count of messages dropped by queue containing postponed view messages.
Type: meter
Qualification: Saturation
daml.sequencer.bftordering.consensus.postponed-view-messages-duplicates
Summary: Count of messages dropped as duplicates by queue containing postponed view messages
Description: Count of messages dropped as duplicates by queue containing postponed view messages.
Type: meter
Qualification: Saturation
daml.sequencer.bftordering.consensus.postponed-view-messages-queue-max-size
Summary: Actual maximum size of the queue containing postponed view messages
Description: Actual maximum size of the queue containing postponed view messages.
Type: gauge
Qualification: Saturation
daml.sequencer.bftordering.consensus.postponed-view-messages-queue-size
Summary: Size of the queue containing postponed view messages
Description: Size of the queue containing postponed view messages.
Type: gauge
Qualification: Saturation
daml.sequencer.bftordering.consensus.retransmitted-commit-certificates
Summary: Retransmitted commit certificates
Description: Number of commit certificates retransmitted during an epoch
Type: meter
Qualification: Traffic
daml.sequencer.bftordering.consensus.retransmitted-messages
Summary: Retransmitted PBFT messages
Description: Number of PBFT messages retransmitted during an epoch
Type: meter
Qualification: Traffic
daml.sequencer.bftordering.consensus.state-transfer.postponed-consensus-messages-dropped
Summary: Count of messages dropped by queue containing consensus messages postponed during state transfer
Description: Count of messages dropped by queue containing consensus messages postponed during state transfer.
Type: meter
Qualification: Saturation
daml.sequencer.bftordering.consensus.state-transfer.postponed-consensus-messages-queue-max-size
Summary: Actual maximum size of the queue containing consensus messages postponed during state transfer
Description: Actual maximum size of the queue containing consensus messages postponed during state transfer.
Type: gauge
Qualification: Saturation
daml.sequencer.bftordering.consensus.state-transfer.postponed-consensus-messages-queue-size
Summary: Size of the queue containing consensus messages postponed during state transfer
Description: Size of the queue containing consensus messages postponed during state transfer.
Type: gauge
Qualification: Saturation
daml.sequencer.bftordering.declarative_api.errors
Summary: Errors for the last update
Description: The node will attempt to apply the changes configured in the declarative config file. A positive number means that some items failed to be synchronised. A negative number means that the overall synchronisation procedure failed with an error. : 0 = everything good, -1 = config file unreadable, -2 = context could not be created, -3 = failure while applying items, -9 = exception caught.
Type: gauge
Qualification: Errors
daml.sequencer.bftordering.declarative_api.items
Summary: Number of items managed through the declarative API
Description: This metric indicates the number of items managed through the declarative API
Type: gauge
Qualification: Debug
daml.sequencer.bftordering.global.ordered-batches
Summary: Batches ordered
Description: Measures the total batches ordered.
Type: meter
Qualification: Traffic
daml.sequencer.bftordering.global.ordered-blocks
Summary: Blocks ordered
Description: Measures the total blocks ordered.
Type: meter
Qualification: Traffic
daml.sequencer.bftordering.global.ordered-requests
Summary: Requests ordered
Description: Measures the total requests ordered.
Type: meter
Qualification: Traffic
daml.sequencer.bftordering.global.requests-ordering-latency
Summary: Requests ordering latency
Description: Records the rate and latency it takes to order requests. This metric is always meaningful when queried on and restricted to the receiving sequencer; in other cases, it is meaningful only when the receiving and reporting sequencers’ clocks are kept synchronized.
Type: timer
Qualification: Latency
daml.sequencer.bftordering.ingress.bytes-queued
Summary: Bytes queued
Description: Measures the size of the mempool in bytes.
Type: gauge
Qualification: Saturation
daml.sequencer.bftordering.ingress.received-bytes
Summary: Bytes received
Description: Measures the total bytes received.
Type: meter
Qualification: Traffic
daml.sequencer.bftordering.ingress.received-requests
Summary: Requests received
Description: Measures the total requests received.
Type: meter
Qualification: Traffic
daml.sequencer.bftordering.ingress.requests-queued
Summary: Requests queued
Description: Measures the size of the mempool in requests.
Type: gauge
Qualification: Saturation
daml.sequencer.bftordering.ingress.requests-size
Summary: Requests size
Description: Records the size of requests to the BFT ordering service.
Type: histogram
Qualification: Traffic
daml.sequencer.bftordering.mempool.requested-batches
Summary: Requested batches
Description: Number of batches requested from the mempool by the availability module.
Type: gauge
Qualification: Saturation
daml.sequencer.bftordering.output.block-delay
Summary: Block delay
Description: Wall-clock time of the ordered block being provided to the sequencer minus BFT time of the block.
Type: timer
Qualification: Latency
daml.sequencer.bftordering.output.block-size-batches
Summary: Block size (batches)
Description: Records the size (in batches) of blocks ordered.
Type: histogram
Qualification: Traffic
daml.sequencer.bftordering.output.block-size-bytes
Summary: Block size (bytes)
Description: Records the size (in bytes) of blocks ordered.
Type: histogram
Qualification: Traffic
daml.sequencer.bftordering.output.block-size-requests
Summary: Block size (requests)
Description: Records the size (in requests) of blocks ordered.
Type: histogram
Qualification: Traffic
daml.sequencer.bftordering.p2p.connections.authenticated
Summary: Authenticated peers
Description: Number of connected P2P endpoints that are also authenticated.
Type: gauge
Qualification: Traffic
daml.sequencer.bftordering.p2p.connections.connected
Summary: Connected peers
Description: Number of connected P2P endpoints.
Type: gauge
Qualification: Traffic
daml.sequencer.bftordering.p2p.receive.processing-latency
Summary: Message receive processing latency
Description: Records the rate and latency when processing incoming P2P network messages.
Type: timer
Qualification: Latency
daml.sequencer.bftordering.p2p.receive.received-bytes
Summary: Bytes received
Description: Total P2P bytes received.
Type: meter
Qualification: Traffic
daml.sequencer.bftordering.p2p.receive.received-messages
Summary: Messages received
Description: Total P2P messages received.
Type: meter
Qualification: Traffic
daml.sequencer.bftordering.p2p.send.grpc-latency
Summary: Latency of a gRPC message send
Description: Records the rate of gRPC message sends and their latency (up to receiving them on the other side).
Type: timer
Qualification: Latency
daml.sequencer.bftordering.p2p.send.network-write-latency
Summary: Message network write latency
Description: Records the rate and latency when writing P2P messages to the network.
Type: timer
Qualification: Latency
daml.sequencer.bftordering.p2p.send.sends-retried
Summary: P2P sends retried
Description: Total P2P network sends retried after a delay due to missing connectivity.
Type: counter
Qualification: Latency
daml.sequencer.bftordering.p2p.send.sent-bytes
Summary: Bytes sent
Description: Total P2P bytes sent.
Type: meter
Qualification: Traffic
daml.sequencer.bftordering.p2p.send.sent-messages
Summary: Messages sent
Description: Total P2P messages sent.
Type: meter
Qualification: Traffic
daml.sequencer.bftordering.performance.ordering-stage-latency
Summary: Ordering stage latency
Description: Records the rate and latency it takes for an ordering stage, which is recorded as a label. This metric is meaningful only when sequencers’ clocks are kept synchronized.
Type: timer
Qualification: Latency
daml.sequencer.bftordering.topology.max-tolerated-faults
Summary: Maximum number of tolerated faults
Description: Maximum number of tolerated faults
Type: gauge
Qualification: Traffic
daml.sequencer.bftordering.topology.query-latency
Summary: Topology query latency
Description: Records the rate and latency when querying the topology client.
Type: timer
Qualification: Latency
daml.sequencer.bftordering.topology.strong-quorum
Summary: Number of non-faulty nodes required for a strong quorum
Description: Number of non-faulty nodes required for a strong quorum, like for consensus
Type: gauge
Qualification: Traffic
daml.sequencer.bftordering.topology.validators
Summary: Active validators
Description: Number of BFT sequencers actively involved in consensus.
Type: gauge
Qualification: Traffic
daml.sequencer.bftordering.topology.weak-quorum
Summary: Number of non-faulty nodes required for a weak quorum
Description: Number of non-faulty nodes required for a weak quorum, like for batch dissemination
Type: gauge
Qualification: Traffic
daml.sequencer.block.acknowledgments_micros*
Summary: Acknowledgments by members in micros
Description:
Type: gauge
Qualification: Latency
- Labels:
member: The sender of the acknowledgment
daml.sequencer.block.delay
Summary: The block processing delay in milliseconds, relative to wall clock
Description: Every block carries a timestamp that was assigned by the ordering service when it ordered the block. This metric shows the difference between the wall clock of the sequencer node and the timestamp of the last processed block. The difference will include the clock-skew and the processing latency of the ordering service. If the delay is large compared to the usual latencies, clock skew can be ruled out, and enough sequencers are not slow, then it means that the node is still trying to catch up reading blocks from the ordering service. This can happen after having been offline for a while or if the node is too slow to keep up with the block processing load.
Type: gauge
Qualification: Latency
daml.sequencer.block.event-bytes*
Summary: Event bytes processed by the sequencer, tagged by type.
Description: Similar to events, except measured by bytes
Type: meter
Qualification: Traffic
- Labels:
member: The sender of the submission request
type: Type of request
daml.sequencer.block.events*
Summary: Events processed by the sequencer, tagged by type.
Description: The sequencer forwards opaque, possibly encrypted payload. However, by looking at the recipient list, the type of message can still be inferred, and tagged appropriately, including the sender.
Type: meter
Qualification: Traffic
- Labels:
member: The sender of the submission request
type: Type of request
daml.sequencer.block.height
Summary: Current block height processed
Description: The submission messages are processed in blocks, where each block has an increasing number. The metric shows the height of the last processed block by the given sequencer node.
Type: gauge
Qualification: Traffic
daml.sequencer.block.stream-buffer-size
Summary: Size of the buffer of Pekko streams after the flow, tagged by stream flow name
Description:
Type: counter
Qualification: Saturation
daml.sequencer.block.stream-element-count
Summary: Number of elements passing through a Pekko streams flow, tagged by stream element
Description:
Type: counter
Qualification: Traffic
daml.sequencer.db-storage.general.executor.exectime
Summary: Execution time metric for database tasks
Description: The time a task is running on the database is measured using this metric.
Type: timer
Qualification: Debug
daml.sequencer.db-storage.general.executor.load
Summary: Load of database pool
Description: Database queries run as tasks on an async executor. This metric shows the current number of queries running in parallel divided by the number database connections for this database connection pool.
Type: gauge
Qualification: Saturation
daml.sequencer.db-storage.general.executor.queued
Summary: Number of database access tasks waiting in queue
Description: Database access tasks get scheduled in this queue and get executed using one of the existing asynchronous sessions. A large queue indicates that the database connection is not able to deal with the large number of requests. Note that the queue has a maximum size. Tasks that do not fit into the queue will be retried, but won’t show up in this metric.
Type: counter
Qualification: Saturation
daml.sequencer.db-storage.general.executor.running
Summary: Number of database access tasks currently running
Description: Database access tasks run on an async executor. This metric shows the current number of tasks running in parallel.
Type: gauge
Qualification: Debug
daml.sequencer.db-storage.general.executor.waittime
Summary: Scheduling time metric for database tasks
Description: Every database query is scheduled using an asynchronous executor with a queue. The time a task is waiting in this queue is monitored using this metric.
Type: timer
Qualification: Debug
daml.sequencer.db-storage.write.executor.exectime
Summary: Execution time metric for database tasks
Description: The time a task is running on the database is measured using this metric.
Type: timer
Qualification: Debug
daml.sequencer.db-storage.write.executor.load
Summary: Load of database pool
Description: Database queries run as tasks on an async executor. This metric shows the current number of queries running in parallel divided by the number database connections for this database connection pool.
Type: gauge
Qualification: Saturation
daml.sequencer.db-storage.write.executor.queued
Summary: Number of database access tasks waiting in queue
Description: Database access tasks get scheduled in this queue and get executed using one of the existing asynchronous sessions. A large queue indicates that the database connection is not able to deal with the large number of requests. Note that the queue has a maximum size. Tasks that do not fit into the queue will be retried, but won’t show up in this metric.
Type: counter
Qualification: Saturation
daml.sequencer.db-storage.write.executor.running
Summary: Number of database access tasks currently running
Description: Database access tasks run on an async executor. This metric shows the current number of tasks running in parallel.
Type: gauge
Qualification: Debug
daml.sequencer.db-storage.write.executor.waittime
Summary: Scheduling time metric for database tasks
Description: Every database query is scheduled using an asynchronous executor with a queue. The time a task is waiting in this queue is monitored using this metric.
Type: timer
Qualification: Debug
daml.sequencer.db.watermark_delay
Summary: The event processing delay in milliseconds, relative to wall clock
Description: Sequencer writes events in parallel using a watermark. This metric shows the difference between the wall clock of the sequencer node and the current watermark of the last written events. The difference will include the clock-skew and the processing latency of the sequencer database write. For block sequencers if the delay is large compared to the usual latencies, clock skew can be ruled out, and enough sequencers are not slow, then it means that the node is still trying to catch up reading blocks from the ordering service. This can happen after having been offline for a while or if the node is too slow to keep up with the block processing load. For database sequencers it means that database system is not being able to keep up with the write load.
Type: gauge
Qualification: Latency
daml.sequencer.declarative_api.errors
Summary: Errors for the last update
Description: The node will attempt to apply the changes configured in the declarative config file. A positive number means that some items failed to be synchronised. A negative number means that the overall synchronisation procedure failed with an error. : 0 = everything good, -1 = config file unreadable, -2 = context could not be created, -3 = failure while applying items, -9 = exception caught.
Type: gauge
Qualification: Errors
daml.sequencer.declarative_api.items
Summary: Number of items managed through the declarative API
Description: This metric indicates the number of items managed through the declarative API
Type: gauge
Qualification: Debug
daml.sequencer.fetch-nonce-duration
Summary: Time to fetch a given nonce from the MemberAuthenticationStore
Description:
Type: timer
Qualification: Debug
daml.sequencer.head_timestamp
Summary: Timestamp of the head (oldest) event in the buffer
Description: The timestamp of the first event in the buffer, or 0 if the buffer is empty
Type: gauge
Qualification: Debug
daml.sequencer.is-active-duration
Summary: Time to run the activeness check in MemberAuthenticationService
Description:
Type: timer
Qualification: Debug
daml.sequencer.last_timestamp
Summary: Timestamp of the last (newest) event in the buffer
Description: The timestamp of the last event in the buffer, or 0 if the buffer is empty
Type: gauge
Qualification: Debug
daml.sequencer.max-event-age
Summary: Age of oldest unpruned sequencer event.
Description: This gauge exposes the age of the oldest, unpruned sequencer event in hours as a way to quantify the pruning backlog.
Type: gauge
Qualification: Debug
daml.sequencer.public-api.processed
Summary: Number of messages processed by the sequencer
Description: This metric measures the number of successfully validated messages processed by the sequencer since the start of this process.
Type: meter
Qualification: Traffic
daml.sequencer.public-api.processed-bytes
Summary: Number of message bytes processed by the sequencer
Description: This metric measures the total number of message bytes processed by the sequencer. If the message received by the sequencer contains duplicate or irrelevant fields, the contents of these fields do not contribute to this metric.
Type: meter
Qualification: Traffic
daml.sequencer.public-api.subscriptions
Summary: Number of active sequencer subscriptions
Description: This metric indicates the number of active subscriptions currently open and actively served subscriptions at the sequencer.
Type: gauge
Qualification: Traffic
daml.sequencer.public-api.time-requests
Summary: Number of time requests received by the sequencer
Description: When a Participant needs to know the synchronizer time it will make a request for a time proof to be sequenced. It would be normal to see a small number of these being sequenced, however if this number becomes a significant portion of the total requests to the sequencer it could indicate that the strategy for requesting times may need to be revised to deal with different clock skews and latencies between the sequencer and participants.
Type: meter
Qualification: Debug
daml.sequencer.traffic-control.balance-cache-miss-for-timestamp
Summary: Counts cache misses when trying to retrieve a balance for a given timestamp.
Description: The per member cache only keeps in memory a subset of all the non-pruned balance updates persisted in the database. If the cache contains some balances for a member but not the one requested, a DB call will be made to try to retrieve it. When that happens, this metric is incremented. If this occurs too frequently, consider increasing the config value of trafficPurchasedCacheSizePerMember.
Type: counter
Qualification: Debug
daml.sequencer.traffic-control.balance-update
Summary: Counts balance updates fully processed by the sequencer.
Description: Value of balance updates for all (aggregated).
Type: counter
Qualification: Traffic
daml.sequencer.traffic-control.event-delivered
Summary: Number of events that were sequenced and delivered.
Description: Counter for event-delivered-cost.
Type: counter
Qualification: Traffic
daml.sequencer.traffic-control.event-delivered-cost
Summary: Cost of events that were sequenced and delivered.
Description: Cost of events for which the sender received confirmation that they were delivered. There is an exception for aggregated submissions: the cost of aggregate events will be recorded as soon as the event is ordered and the sequencer waits to receive threshold-many events. The final event may or may not be delivered successfully depending on the result of the aggregation.
Type: meter
Qualification: Traffic
daml.sequencer.traffic-control.event-rejected
Summary: Number of events that were sequenced but not delivered.
Description: Counter for event-rejected-cost.
Type: counter
Qualification: Traffic
daml.sequencer.traffic-control.event-rejected-cost
Summary: Cost of events that were sequenced but no delivered successfully.
Description: Cost of events for which the sender received confirmation that the events will not be delivered. The reason for non-delivery is labeled on the metric, if available.
Type: meter
Qualification: Traffic
daml.sequencer.traffic-control.submitted-event-cost
Summary: Cost of event submitted from the sequencer client.
Description: When the sequencer client sends an event to the sequencer to be sequenced, it will record on this metric the cost of the event. Note that the event may or may not end up being sequenced. So this metric may not exactly match the actual consumed traffic.
Type: meter
Qualification: Traffic
daml.sequencer.traffic-control.wasted-sequencing
Summary: Byte size of events that got sequenced but failed to pass validation steps after sequencing
Description: Record the raw byte size of events that are ordered but were not delivered because of traffic enforcement.
Type: meter
Qualification: Traffic
daml.sequencer.traffic-control.wasted-sequencing-counter
Summary: Number of events that failed traffic validation and were not delivered because of it.
Description: Counter for wasted-sequencing.
Type: counter
Qualification: Traffic
daml.sequencer.traffic-control.wasted-traffic
Summary: Cost of event that was deducted but not delivered.
Description: Events can have their cost deducted but still not be delivered due to other failed validation after ordering. This metrics records the traffic cost of such events.
Type: meter
Qualification: Traffic
daml.sequencer.traffic-control.wasted-traffic-counter
Summary: Number of events that cost traffic but were not delivered.
Description: Counter for wasted-traffic.
Type: counter
Qualification: Traffic
Mediator Metrics
daml.db-storage.general.executor.exectime
Summary: Execution time metric for database tasks
Description: The time a task is running on the database is measured using this metric.
Type: timer
Qualification: Debug
daml.db-storage.general.executor.load
Summary: Load of database pool
Description: Database queries run as tasks on an async executor. This metric shows the current number of queries running in parallel divided by the number database connections for this database connection pool.
Type: gauge
Qualification: Saturation
daml.db-storage.general.executor.queued
Summary: Number of database access tasks waiting in queue
Description: Database access tasks get scheduled in this queue and get executed using one of the existing asynchronous sessions. A large queue indicates that the database connection is not able to deal with the large number of requests. Note that the queue has a maximum size. Tasks that do not fit into the queue will be retried, but won’t show up in this metric.
Type: counter
Qualification: Saturation
daml.db-storage.general.executor.running
Summary: Number of database access tasks currently running
Description: Database access tasks run on an async executor. This metric shows the current number of tasks running in parallel.
Type: gauge
Qualification: Debug
daml.db-storage.general.executor.waittime
Summary: Scheduling time metric for database tasks
Description: Every database query is scheduled using an asynchronous executor with a queue. The time a task is waiting in this queue is monitored using this metric.
Type: timer
Qualification: Debug
daml.db-storage.write.executor.exectime
Summary: Execution time metric for database tasks
Description: The time a task is running on the database is measured using this metric.
Type: timer
Qualification: Debug
daml.db-storage.write.executor.load
Summary: Load of database pool
Description: Database queries run as tasks on an async executor. This metric shows the current number of queries running in parallel divided by the number database connections for this database connection pool.
Type: gauge
Qualification: Saturation
daml.db-storage.write.executor.queued
Summary: Number of database access tasks waiting in queue
Description: Database access tasks get scheduled in this queue and get executed using one of the existing asynchronous sessions. A large queue indicates that the database connection is not able to deal with the large number of requests. Note that the queue has a maximum size. Tasks that do not fit into the queue will be retried, but won’t show up in this metric.
Type: counter
Qualification: Saturation
daml.db-storage.write.executor.running
Summary: Number of database access tasks currently running
Description: Database access tasks run on an async executor. This metric shows the current number of tasks running in parallel.
Type: gauge
Qualification: Debug
daml.db-storage.write.executor.waittime
Summary: Scheduling time metric for database tasks
Description: Every database query is scheduled using an asynchronous executor with a queue. The time a task is waiting in this queue is monitored using this metric.
Type: timer
Qualification: Debug
daml.grpc.server
Summary: Distribution of the durations of serving gRPC requests.
Description:
Type: timer
Qualification: Latency
daml.grpc.server.handled
Summary: Total number of handled gRPC requests.
Description:
Type: meter
Qualification: Traffic
daml.grpc.server.messages.received
Summary: Total number of gRPC messages received (on either type of connection).
Description:
Type: meter
Qualification: Traffic
daml.grpc.server.messages.received.bytes
Summary: Distribution of payload sizes in gRPC messages received (both unary and streaming).
Description:
Type: histogram
Qualification: Traffic
daml.grpc.server.messages.sent
Summary: Total number of gRPC messages sent (on either type of connection).
Description:
Type: meter
Qualification: Traffic
daml.grpc.server.messages.sent.bytes
Summary: Distribution of payload sizes in gRPC messages sent (both unary and streaming).
Description:
Type: histogram
Qualification: Traffic
daml.grpc.server.requests.rejections*
Summary: Number of rejected requests due to active request limits.
Description: Counts the number of requests rejected because the active request limit was reached.
Type: counter
Qualification: Saturation
- Labels:
method: The method / service name limited.
service: The API the method belongs to
api: The API the method belongs to
daml.grpc.server.started
Summary: Total number of started gRPC requests (on either type of connection).
Description:
Type: meter
Qualification: Traffic
daml.mediator.approved-requests
Summary: Total number of approved confirmation requests
Description: This metric provides the total number of approved confirmation requests since the system has been started. A confirmation request is approved if all the required confirmations are received by the mediator within the decision time.
Type: meter
Qualification: Debug
daml.mediator.declarative_api.errors
Summary: Errors for the last update
Description: The node will attempt to apply the changes configured in the declarative config file. A positive number means that some items failed to be synchronised. A negative number means that the overall synchronisation procedure failed with an error. : 0 = everything good, -1 = config file unreadable, -2 = context could not be created, -3 = failure while applying items, -9 = exception caught.
Type: gauge
Qualification: Errors
daml.mediator.declarative_api.items
Summary: Number of items managed through the declarative API
Description: This metric indicates the number of items managed through the declarative API
Type: gauge
Qualification: Debug
daml.mediator.max-event-age
Summary: Age of oldest unpruned confirmation response.
Description: This gauge exposes the age of the oldest, unpruned confirmation response in hours as a way to quantify the pruning backlog.
Type: gauge
Qualification: Debug
daml.mediator.outstanding-requests
Summary: Number of currently outstanding requests
Description: This metric provides the number of currently open requests registered with the mediator.
Type: gauge
Qualification: Debug
daml.mediator.requests
Summary: Total number of processed confirmation requests (approved and rejected)
Description: This metric provides the number of processed confirmation requests since the system has been started. Requests that are rejected because they reuse the request UUID are labelled with duplicate_reject.
Type: meter
Qualification: Debug
daml.mediator.timeout-non-responsive-participants
Summary: Count of participants that failed to respond for parties before timeout
Description: This metric tracks participant non-responsiveness during confirmation request timeouts. When a mediator times out a transaction, it increments this counter once for each party that the participant hosts (with confirmation rights) but did not respond for. The metric includes labels for both the party and the participant to enable detailed analysis.
Type: meter
Qualification: Debug
daml.sequencer-client.handler.actual-in-flight-event-batches
Summary: Nodes process the events from the synchronizer’s sequencer in batches. This metric tracks how many such batches are processed in parallel.
Description: Incoming messages are processed by a sequencer client, which combines them into batches of size up to ‘event-inbox-size’ before sending them to an application handler for processing. Depending on the system’s configuration, the rate at which event batches are sent to the handler may be throttled to avoid overwhelming it with too many events at once. Indicators that the configured upper bound may be too low: This metric constantly is close to the configured maximum, which is exposed via ‘max-in-flight-event-batches’, while the system’s resources are under-utilized. Indicators that the configured upper bound may be too high: Out-of-memory errors crashing the JVM or frequent garbage collection cycles that slow down processing. The metric tracks how many of these batches have been sent to the application handler but have not yet been fully processed. This metric can help identify potential bottlenecks or issues with the application’s processing of events and provide insights into the overall workload of the system.
Type: counter
Qualification: Saturation
daml.sequencer-client.handler.application-handle
Summary: Timer monitoring time and rate of sequentially handling the event application logic
Description: All events are received sequentially. This handler records the rate and time it takes the application (participant or mediator) to handle the events.
Type: timer
Qualification: Debug
daml.sequencer-client.handler.delay
Summary: The delay on the event processing in milliseconds
Description: Every message received from the sequencer carries a timestamp that was assigned by the sequencer when it sequenced the message. This timestamp is called the sequencing timestamp. The component receiving the message on the participant or mediator is the sequencer client, while on the block sequencer itself, it’s the block update generator. Upon having received the same message from enough sequencers (as configured by the trust threshold), the sequencer client compares the time difference between the sequencing time and the computers local clock and exposes this difference as the given metric. The difference will include the clock-skew and the processing latency between assigning the timestamp on the sequencer and receiving the message by the recipient from enough sequencers. If the difference is large compared to the usual latencies, clock skew can be ruled out, and enough sequencers are not slow, then it means that the node is still trying to catch up with events that the sequencers sequenced a while ago. This can happen after having been offline for a while or if the node is too slow to keep up with the messaging load.
Type: gauge
Qualification: Debug
daml.sequencer-client.handler.last-sequencing-time-micros
Summary: The sequencing time of the last processed event in microseconds since unix epoch
Description: Every message received from the sequencer carries a timestamp that was assigned by the sequencer when it sequenced the message. This timestamp is called the sequencing timestamp. The component receiving the message on the participant or mediator is the sequencer client, while on the block sequencer itself, it’s the block update generator. Upon having received the same message from enough sequencers (as configured by the trust threshold), this metric is updated with the sequencing time of that message.
Type: gauge
Qualification: Debug
daml.sequencer-client.handler.max-in-flight-event-batches
Summary: Nodes process the events from the synchronizer’s sequencer in batches. This metric tracks the upper bound of such batches being processed in parallel.
Description: Incoming messages are processed by a sequencer client, which combines them into batches of size up to ‘event-inbox-size’ before sending them to an application handler for processing. Depending on the system’s configuration, the rate at which event batches are sent to the handler may be throttled to avoid overwhelming it with too many events at once. Configured by ‘maximum-in-flight-event-batches’ parameter in the sequencer-client config The metric shows the configured upper limit on how many batches the application handler may process concurrently. The metric ‘actual-in-flight-event-batches’ tracks the actual number of currently processed batches.
Type: gauge
Qualification: Debug
daml.sequencer-client.handler.sequencer-events
Summary: Number of received events from the sequencer
Description: A participant reads events from the sequencer. This metric captures the count and rate of events.
Type: counter
Qualification: Debug
daml.sequencer-client.sequencer-connection-pool.active-subscriptions
Summary: Number of active subscriptions in the subscription pool
Description: This metric indicates the current number of subscriptions that are active.
Type: gauge
Qualification: Saturation
daml.sequencer-client.sequencer-connection-pool.grpc-requests
Summary: Number of gRPC requests sent on this connection
Description: This metric indicates the number of gRPC requests that have been sent on this connection.
Type: counter
Qualification: Saturation
daml.sequencer-client.sequencer-connection-pool.subscription-threshold
Summary: Sum of trust threshold and liveness margin configured in the subscription pool
Description: The liveness margin determines how many subscriptions on different sequencers are continuously maintained, beyond the minimum number defined by the trust threshold. In other words, the subscription pool will strive to maintain at all times (trust threshold + liveness margin)-many subscriptions active. This provides tolerance to subscriptions falling, enabling the node to continue operating while some sequencers are down.
Type: gauge
Qualification: Saturation
daml.sequencer-client.sequencer-connection-pool.tracked-connections
Summary: Number of connections tracked by the connection pool
Description: The configuration of the connection pool defines the parameters of the sequencer connections. This metrics shows the current number of those connections.
Type: gauge
Qualification: Saturation
daml.sequencer-client.sequencer-connection-pool.trust-threshold
Summary: Trust threshold configured in the connection pool
Description: The trust threshold determines how many connections to sequencers must be available and consistent (same synchronizer ID, same protocol version, same static parameters) for the connection pool to initialize. Furthermore, it also determines the number of sequencer subscriptions that must deliver identical copies of an event for that event to be accepted and processed by the node.
Type: gauge
Qualification: Saturation
daml.sequencer-client.sequencer-connection-pool.validated-connections
Summary: Number of connections validated by the connection pool
Description: This metric indicates the current number of connections that are up and validated. These connections are available for components of the node that need to communicate with the synchronizer.
Type: gauge
Qualification: Saturation
daml.sequencer-client.submissions.amplification
Summary: Rate and timings of submission request attempts to a sequencer
Description: This timer is started when a submission request attempt is sent to the sequencer, and completed when it is observed as sequenced. If the attempt is not observed as sequenced before the amplification patience expires, no timing will be recorded for this and the following attempts.
Type: timer
Qualification: Latency
daml.sequencer-client.submissions.amplified-attempts
Summary: Count of send request attempts which are amplified
Description: Counter that is incremented if a send request attempt, which did not receive a synchronous error from the sequencer, is not observed as sequenced until the amplification patience expires and a new attempt is sent.
Type: meter
Qualification: Errors
daml.sequencer-client.submissions.attempt-sync-errors
Summary: Count of send request attempts which receive a synchronous error
Description: Counter that is incremented if a send request attempt receives a synchronous error from the sequencer.
Type: meter
Qualification: Errors
daml.sequencer-client.submissions.dropped
Summary: Count of send requests that did not cause an event to be sequenced
Description: Counter of send requests we did not witness a corresponding event to be sequenced by the supplied max-sequencing-time. There could be many reasons for this happening: the request may have been lost before reaching the sequencer, the sequencer may be at capacity and the the max-sequencing-time was exceeded by the time the request was processed, or the supplied max-sequencing-time may just be too small for the sequencer to be able to sequence the request.
Type: counter
Qualification: Errors
daml.sequencer-client.submissions.in-flight
Summary: Number of sequencer send requests we have that are waiting for an outcome or timeout
Description: Incremented on every successful send to the sequencer. Decremented when the event or an error is sequenced, or when the max-sequencing-time has elapsed.
Type: counter
Qualification: Debug
daml.sequencer-client.submissions.no-connection-available
Summary: Count of send attempts which are skipped because no connection is available
Description: Counter that is incremented if a send request attempt is skipped because there is no connection available.
Type: meter
Qualification: Errors
daml.sequencer-client.submissions.overloaded
Summary: Count of send requests which receive an overloaded response
Description: Counter that is incremented if a send request receives an overloaded response from the sequencer.
Type: counter
Qualification: Errors
daml.sequencer-client.submissions.sends
Summary: Rate and timings of send requests to the sequencer
Description: Provides a rate and time of how long it takes for send requests to be accepted by the sequencer. Note that this is just for the request to be made and not for the requested event to actually be sequenced.
Type: timer
Qualification: Debug
daml.sequencer-client.submissions.sequencing
Summary: Rate and timings of sequencing requests
Description: This timer is started when a submission is made to the sequencer and then completed when a corresponding event is witnessed from the sequencer, so will encompass the entire duration for the sequencer to sequence the request. If the request does not result in an event no timing will be recorded.
Type: timer
Qualification: Latency
daml.sequencer-client.traffic-control.event-delivered
Summary: Number of events that were sequenced and delivered.
Description: Counter for event-delivered-cost.
Type: counter
Qualification: Traffic
daml.sequencer-client.traffic-control.event-delivered-cost
Summary: Cost of events that were sequenced and delivered.
Description: Cost of events for which the sender received confirmation that they were delivered. There is an exception for aggregated submissions: the cost of aggregate events will be recorded as soon as the event is ordered and the sequencer waits to receive threshold-many events. The final event may or may not be delivered successfully depending on the result of the aggregation.
Type: meter
Qualification: Traffic
daml.sequencer-client.traffic-control.event-rejected
Summary: Number of events that were sequenced but not delivered.
Description: Counter for event-rejected-cost.
Type: counter
Qualification: Traffic
daml.sequencer-client.traffic-control.event-rejected-cost
Summary: Cost of events that were sequenced but no delivered successfully.
Description: Cost of events for which the sender received confirmation that the events will not be delivered. The reason for non-delivery is labeled on the metric, if available.
Type: meter
Qualification: Traffic
daml.sequencer-client.traffic-control.submitted-event-cost
Summary: Cost of event submitted from the sequencer client.
Description: When the sequencer client sends an event to the sequencer to be sequenced, it will record on this metric the cost of the event. Note that the event may or may not end up being sequenced. So this metric may not exactly match the actual consumed traffic.
Type: meter
Qualification: Traffic
Health Metrics
The following metrics are exposed for all components.
daml_health_status
Description: The status of the component
Values:
0: Not healthy
1: Healthy
Labels:
component: the name of the component being monitored
Type: Gauge
gRPC Metrics
The following metrics are exposed for all gRPC endpoints. These metrics have the following common labels attached:
- grpc_service_name:
fully qualified name of the gRPC service (e.g.
com.daml.ledger.api.v1.ActiveContractsService)
- grpc_method_name:
name of the gRPC method (e.g.
GetActiveContracts)
- grpc_client_type:
type of client connection (
unaryorstreaming)
- grpc_server_type:
type of server connection (
unaryorstreaming)
- service:
Canton service’s name (e.g.
participant,sequencer, etc.)
daml_grpc_server_duration_seconds
Description: Distribution of the durations of serving gRPC requests
Type: Histogram
daml_grpc_server_messages_sent_total
Description: Total number of gRPC messages sent (on either type of connection)
Type: Counter
daml_grpc_server_messages_received_total
Description: Total number of gRPC messages received (on either type of connection)
Type: Counter
daml_grpc_server_started_total
Description: Total number of started gRPC requests (on either type of connection)
Type: Counter
daml_grpc_server_handled_total
Description: Total number of handled gRPC requests
Labels:
grpc_code: returned gRPC status code for the call (
OK,CANCELLED,INVALID_ARGUMENT, etc.)
Type: Counter
daml_grpc_server_messages_sent_bytes
Description: Distribution of payload sizes in gRPC messages sent (both unary and streaming)
Type: Histogram
daml_grpc_server_messages_received_bytes
Description: Distribution of payload sizes in gRPC messages received (both unary and streaming)
Type: Histogram
HTTP Metrics
The following metrics are exposed for all HTTP endpoints. These metrics have the following common labels attached:
- http_verb:
HTTP verb used for a given call (e.g.
GETorPUT)
- host:
fully qualified hostname of the HTTP endpoint (e.g.
example.com)
- path:
path of the HTTP endpoint (e.g.
/v2/parties)
- service:
Daml service’s name (
json_apifor the JSON Ledger API Service)
daml_http_requests_duration_seconds
Description: Distribution of the durations of serving HTTP requests
Type: Histogram
daml_http_requests_total
Description: Total number of HTTP requests completed
Labels:
http_status: returned HTTP status code for the call
Type: Counter
daml_http_websocket_messages_received_total
Description: Total number of WebSocket messages received
Type: Counter
daml_http_websocket_messages_sent_total
Description: Total number of WebSocket messages sent
Type: Counter
daml_http_requests_payload_bytes
Description: Distribution of payload sizes in HTTP requests received
Type: Histogram
daml_http_responses_payload_bytes
Description: Distribution of payload sizes in HTTP responses sent
Type: Histogram
daml_http_websocket_messages_received_bytes
Description: Distribution of payload sizes in WebSocket messages received
Type: Histogram
daml_http_websocket_messages_sent_bytes
Description: Distribution of payload sizes in WebSocket messages sent
Type: Histogram
Pruning Metrics
The following metrics are exposed for all pruning processes. These metrics have the following labels:
- phase:
The name of the pruning phase being monitored
daml_services_pruning_prune_started_total
Description: Total number of started pruning processes
Type: Counter
daml_services_pruning_prune_completed_total
Description: Total number of completed pruning processes
Type: Counter
JVM Metrics
The following metrics are exposed for the JVM, if enabled.
runtime_jvm_gc_time
Description: Time spent in a given JVM garbage collector in milliseconds
Labels:
gc: Garbage collector regions (eg:
G1 Old Generation,G1 New Generation)
Type: Counter
runtime_jvm_gc_count
Description: The number of collections that have occurred for a given JVM garbage collector
Labels:
gc: Garbage collector regions (eg:
G1 Old Generation,G1 New Generation)
Type: Counter
runtime_jvm_memory_area
Description: JVM memory area statistics
Labels:
area: Can be
heapornon_heaptype: Can be
committed,usedormax
runtime_jvm_memory_pool
Description: JVM memory pool statistics
Labels:
pool: Defined pool name.
type: Can be
committed,usedormax
Logging
Canton uses Logback as the logging library. All Canton logs derive from the logger com.digitalasset.canton. By default, Canton will write a log to the file log/canton.log using the INFO
log-level and will also log WARN and ERROR to stdout.
How Canton produces log files can be configured extensively on the command line using the following options:
-v(or--verbose) is a short option to set the Canton log level toDEBUG. This is likely the most common log option you will use.--debugsets all log levels except stdout toDEBUG. Stdout is set toINFO. Note thatDEBUGlogs of external libraries can be very noisy.--log-level-root=<level>configures the log-level of the root logger. This changes the log level of Canton and of external libraries, but not of stdout.--log-level-canton=<level>configures the log-level of only the Canton logger.--log-level-stdout=<level>configures the log-level of stdout. This will usually be the text displayed in the Canton console.--log-file-name=log/canton.logconfigures the location of the log file.--log-file-appender=flat|rolling|offconfigures if and how logging to a file should be done. The rolling appender will roll the files according to the defined date-time pattern.--log-file-rolling-history=12configures the number of historical files to keep when using the rolling appender.--log-file-rolling-pattern=YYYY-mm-ddconfigures the rolling file suffix (and therefore the frequency) of how files should be rolled.--log-truncateconfigures whether the log file should be truncated on startup.--log-profile=containerprovides a default set of logging settings for a particular setup. Only thecontainerprofile is supported, which logs to both STDOUT and to 10-hour limited rolling log files history (to avoid storage leaks).--log-immediate-flush=falseturns off immediate flushing of the log output to the log file.
Note that if you use --log-profile, the order of the command line arguments matters. The profile settings can be overridden on the command line by placing adjustments after the profile has been selected.
Canton supports the normal log4j logging levels: TRACE, DEBUG, INFO, WARN, and ERROR.
For further customization, a custom logback configuration can be provided using JAVA_OPTS.
JAVA_OPTS="-Dlogback.configurationFile=./path-to-file.xml" ./bin/canton --config ...
If you use a custom log-file, the command line arguments for logging will not have any effect, except that --log-level-canton and --log-level-root can still be used to adjust the log level of the root loggers.
Viewing Logs
A log file viewer such as lnav is recommended to view Canton logs and resolve issues. Among other features, lnav has automatic syntax highlighting, convenient filtering for specific log messages, and the ability to view log files of different Canton components in a single view. This makes viewing logs and resolving issues more efficient than using standard UNIX tools such as less or grep.
The following features are especially useful when using lnav:
Viewing log files of different Canton components in a single view, merged according to timestamps (
lnav <log1> <log2> ...).Filtering specific log messages in (
:filter-in <regex>) or out (:filter-out <regex>). When filtering messages (for example, with a given trace-id), a transaction can be traced across different components, especially when using the single-view-feature described earlier.Searching for specific log messages (
/<regex>) and jumping between them (nandN).Automatic syntax highlighting of parts of log messages (such as timestamps) and log messages themselves (for example,
WARNlog messages are yellow).Jumping between error (
eandE) and warn messages (wandW).Selectively activating and deactivating different filters and files (
TABand `` `` to activate/deactivate a filter).Marking lines (
m) and jumping back and forth between marked lines (uandU).Jumping back and forth between lines that have the same trace-id (
oandO).
The custom lnav log format file for Canton logs canton.lnav.json is bundled in any Canton release. You can install it with lnav -i canton.lnav.json. JSON-based log files (which need to use the file suffix .clog) can be viewed using the canton-json.lnav.json format file.
Detailed Logging
By default, logging omits details to avoid writing sensitive data into log files. For debugging or educational purposes, you can turn on additional logging using the following configuration switches:
canton.monitoring.logging {
    event-details = true
    api {
        message-payloads = true
        max-method-length = 1000
        max-message-lines = 10000
        max-string-length = 10000
        max-metadata-size = 10000
    }
}
This turns on payload logging in the ApiRequestLogger, which records every GRPC API invocation, and turns on detailed logging of the SequencerClient and the transaction trees. Please note that all additional events are logged at DEBUG level.
Note
Note that the detailed event logging will happen within an gRPC API Interceptor. This creates a sequential bottleneck as every message that is sent or received gets translated into a pretty-printed string. You will not be able to achieve the same performance if this setting is turned on.
Tracing
For further debugging, Canton provides a trace-id which allows you to trace the processing
of requests through the system. The trace-id is exposed to logback through the
mapping diagnostic context and can be included in the logback output pattern using %mdc{trace-id}.
The trace-id propagation is enabled by setting the canton.monitoring.tracing.propagation = enabled configuration option, which is enabled by default.
You can configure the service where traces and spans are reported for observing distributed traces. Refer to Traces for a preview.
Jaeger and Zipkin are supported. For example, Jaeger reporting can be configured as follows:
monitoring.tracing.tracer.exporter {
  type = jaeger
  address = ... // default: "localhost"
  port = ... // default: 14250
}
This configuration connects to a running Jaeger server to report tracing information.
You can run Jaeger in a Docker container as follows:
docker run --rm -it --name jaeger\
  -p 16686:16686 \
  -p 14250:14250 \
  jaegertracing/all-in-one:1.22.0
If you prefer not to use Docker, you can download the binary for your specific OS at Download Jaeger. Unzip the file and then run the binary jaeger-all-in-one (no arguments are needed). By default, Jaeger will expose port 16686 (for its UI, which can be seen in a browser window) and port 14250 (to which Canton will report trace information). Be sure to properly expose these ports.
Make sure that all Canton nodes in the network report to the same Jaeger server to have an accurate view of the full traces. Also, ensure that the Jaeger server is reachable by all Canton nodes.
Apart from jaeger, Canton nodes can also be configured to report in Zipkin or OTLP formats.
Sampling
You can change how often spans are sampled and reported to the configured exporter. By default, it will always report (monitoring.tracing.tracer.sampler.type = always-on). You can configure it to never report (monitoring.tracing.tracer.sampler.type = always-off), although this is less useful. Also, you can configure only a specific fraction of spans to be reported as follows:
monitoring.tracing.tracer.sampler = {
  type = trace-id-ratio
  ratio = 0.5
}
You can also change the parent-based sampling property. By default, it is turned on (monitoring.tracing.tracer.sampler.parent-based = true). When turned on, a span is sampled iff its parent is sampled (the root span will follow the configured sampling strategy). There will never be incomplete traces; either the full trace is sampled or it is not. If you change this property, all spans will follow the configured sampling strategy and ignore whether the parent is sampled.
Known Limitations
Not every trace created which can be observed in logs is reported to the configured trace collector service. Traces originated at console commands or that are part of the transaction protocol are largely reported, while other types of traces are added to the set of reported traces as the need arises.
Also, the transaction protocol trace has a known limitation: once a command is submitted and its trace is fully reported, a new trace is created for any resulting Daml events that are processed. This occurs because the Ledger API does not propagate any trace context information from the command submission to the transaction subscription. As an example, when a participant creates a Ping contract, you can see the full transaction processing trace of the Ping command being submitted. However, a participant that processes the Ping by exercising Respond and creating a Pong contract creates a separate trace instead of using the same one.
This differs from a situation where a single Daml transaction results in multiple actions at the same time, such as archiving and creating multiple contracts. In that case, a single trace encompasses the entire process, since it occurs as part of a single transaction rather than the result of an external process reacting to Daml events.
Traces
Traces contain operations that are each represented by a span. A trace is a directed acyclic graph (DAG) of spans, where the edges between spans are defined as parent/child relationships (the definitions come from the Opentelemetry glossary).
Canton reports several types of traces. One example: every Canton console command that interacts with the Admin API starts a trace whose initial span last for the entire duration of the command, including the GRPC call to the specific Admin API endpoint.
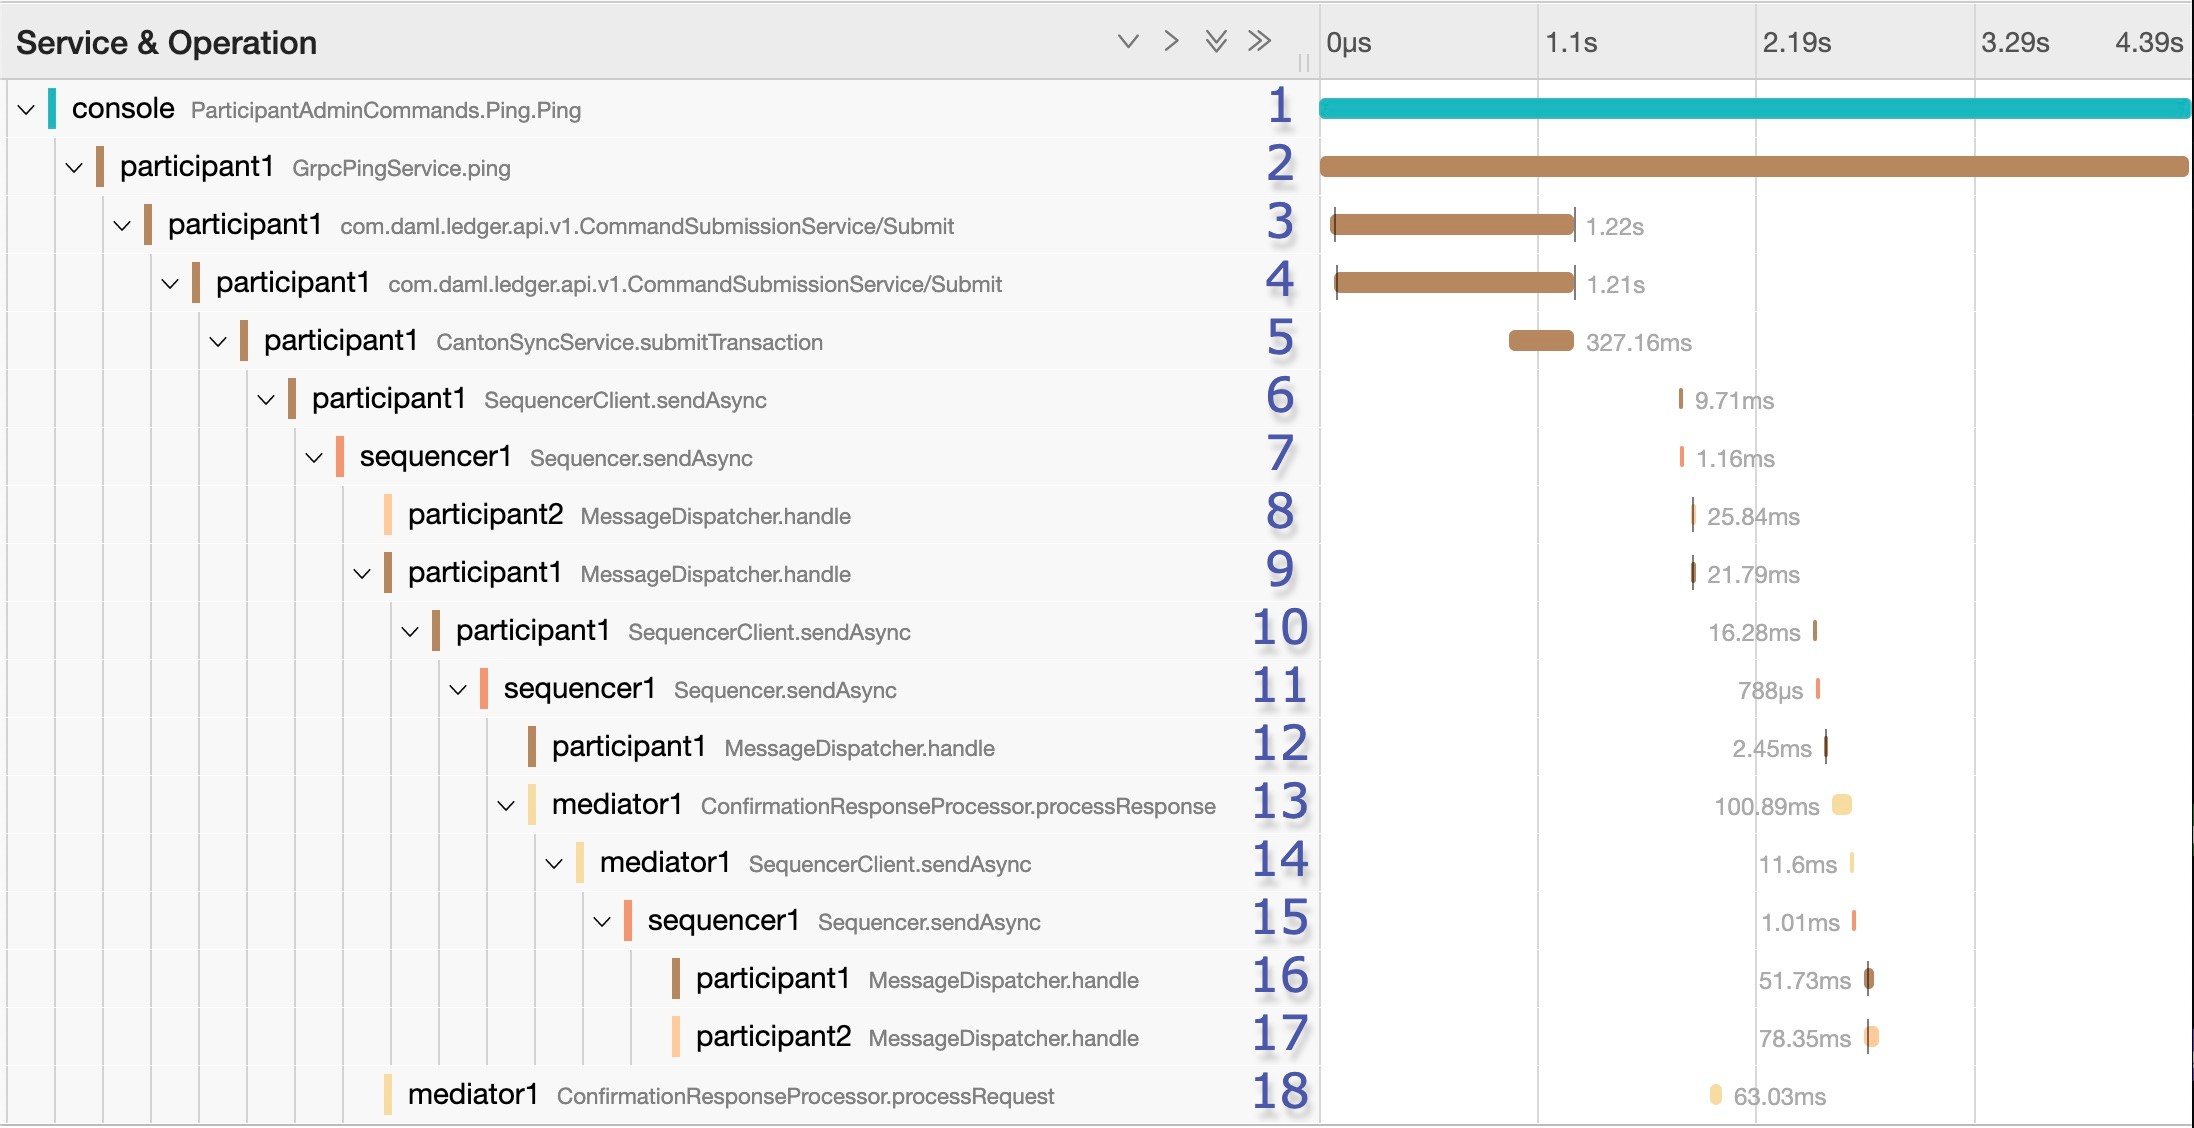
Graph of a Canton ping trace containing 18 spans
Traces of Daml command submissions are important. The trace illustrated in the figure results when you perform a Canton ping using the console. The ping is a smoke test that sends a Daml transaction (create Ping, exercise choice Pong, exercise choice Archive) to test a connection. It uses a particular smart contract that is preinstalled on every Canton participant. The command uses the Admin API to access a preinstalled application, which then issues Ledger API commands operating on this smart contract. In this example, the trace contains 18 spans. The ping is started by participant1, and participant2 is the target. The trace focuses on the message exchange through the sequencer without digging deep into the message handlers or further processing of transactions.
In some cases, spans may start later than the end of their parents, due to asynchronous processing. This typically occurs when a new operation is placed on a queue to be handled later, which immediately frees the parent span and ends it.
The initial span (span 1) covers the duration of the ping operation. In span 2, the GrpcPingService in the participant node handles a GRPC request made by the console. It also lasts for the duration of the ping operation.
The Canton ping consists of three Daml commands:
The admin party for
participant1creates aPingcontract.The admin party for
participant2exercises theRespondconsuming choice on the contract, which results in the creation of aPongcontract.The admin party for
participant1exercises theAckconsuming choice on it.
The submission of the first of the three Daml commands (the creation of the Ping contract) starts at span 3 in the example trace. Due to a limitation explained in the next section, the other two Daml command submissions are not linked to this trace. It is possible to find them separately. In any case, span 2 will only complete once the three Daml commands are completed.
At span 3, the participant node is on the client side of the Ledger API. In other use cases, it could be an application integrated with the participant. This span lasts for the duration of the GRPC call, which is received on the server side in span 4 and handled by the CantonSyncService in span 5. The request is then received and acknowledged, but not fully processed. It is processed asynchronously later, which means that spans 3 through 5 will complete before the request is handled.
Missing steps from the trace (which account for part of the gap between spans 5 and 6) are:
The synchronizer routing where the participant decides which synchronizer to use for the command submission.
The preparation of the initial set of messages to be sent.
The start of the Canton transaction protocol begins at span 6. In this span, participant1 sends a request to sequencer1 to sequence the initial set of confirmation request messages as part of phase 1 of the transaction protocol. The transaction protocol has seven phases.
At span 7, sequencer1 receives the request and registers it. Receipt of the messages is not part of this span. That happens asynchronously at a later point.
At span 18, as part of phase 2, mediator1 receives an informee message. It only needs to validate and register it. Since it doesn’t need to respond, span 18 has no children.
As part of phase 3, participant2 receives a message (see span 8), and participant1 also receives a message (see span 9). Both participants asynchronously validate the messages. participant2 does not need to respond. Since it is only an observer, span 8 has no children. participant1 responds, however, which is visible at span 10. There, it again makes a call to sequencer1, which receives it at span 11.
At span 12, participant1 receives a successful send response message that signals that its message to the mediator was successfully sequenced. This occurs as part of phase 4, where confirmation responses are sent to the mediator. The mediator receives it at span 13, and it validates the message (phase 5).
In spans 14 and 15, mediator1 (now at phase 6) asks sequencer1 to send the transaction result messages to the participants.
To end this round of the transaction protocol, participant1 and participant2 receive their messages at spans 16 and 17, respectively. The messages are asynchronously validated, and their projections of the virtual shared ledger are updated (phase 7).
As mentioned, there are two other transaction submissions that are unlinked from this ping trace but are part of the operation.
The second one starts at a span titled admin-ping.processTransaction, which is created by participant2. The third one has the same name but is initiated by participant1.
Node Health Status
Each Canton node exposes rich health status information. Running:
<node>.health.status
returns a status object, which can be one of:
Failure: if the status of the node cannot be determined, including an error message of why it failedNotInitialized: if the node is not yet initializedSuccess[NodeStatus]: if the status could be determined, including the detailed status
The NodeStatus differs depending on the node type. A participant node responds with a message containing:
Participant id: the participant id of the nodeUptime: the uptime of this nodePorts: the ports on which the participant node exposes the Ledger and the Admin API.Connected synchronizers: the list of synchronizers to which the participant is properly connectedUnhealthy synchronizers: the list of synchronizers to which the participant is trying to connect, but the connection is not ready for command submissionActive: true if this instance is the active replica (It can be false in the case of the passive instance of a high-availability deployment.)
A synchronizer node or a sequencer node responds with a message containing:
Synchronizer id: the unique identifier of the synchronizerUptime: the uptime of this nodePorts: the ports on which the synchronizer exposes the Public and the Admin APIConnected Participants: the list of connected participantsSequencer: a boolean flag indicating whether the embedded sequencer writer is operational
A sequencer node also returns the following additional field starting from Canton 2.8.6:
Accepts admin changes: a boolean flag indicating whether the sequencer accepts admin changes
A synchronizer topology manager or a mediator node returns:
Node uid: the unique identifier of the nodeUptime: the uptime of this nodePorts: the ports on which the node hosts its APIsActive: true if this instance is the active replica (It can be false in the case of the passive instance of a high-availability deployment.)
Additionally, all nodes also return a components field detailing the health state of each of its internal runtime dependencies. The actual components differ per node and can give further insights into the node’s current status. Example components include storage access, synchronizer connectivity, and sequencer backend connectivity.
Health Checks
gRPC Health Check Service
Each Canton node can optionally be configured to start a gRPC server exposing the gRPC Health Service. Passive nodes (see High Availability for more information on active/passive states) return NOT_SERVING. Consider this when configuring liveness and readiness probes in a Kubernetes environment.
The precise way the state is computed is subject to change.
Here is an example monitoring configuration to place inside a node configuration object:
monitoring.grpc-health-server {
    address = localhost
    port = 10003
}
Note
The gRPC health server is configured per Canton node, not per process, as is the case for the HTTP health check server (see below). This means that the configuration must be inserted within a node’s configuration object.
Note
To support usage as a Kubernetes liveness probe, the health server exposes a service named liveness that should be targeted when configuring a gRPC probe.
The latter service always returns SERVING.
HTTP Health Check
Optionally, the Canton node can expose an HTTP endpoint indicating whether the process believes it is healthy. This may be used as an uptime check or as a Kubernetes liveness probe. If enabled, the /health endpoint will respond to a GET HTTP request with a 200 HTTP status code (if healthy) or 500 (if unhealthy, along with a plain text description of why it is unhealthy).
Here is an example monitoring configuration to place inside a node configuration object:
monitoring.http-health-server {
    address = localhost
    port = 10004
}
Health Dumps
You should provide as much information as possible to receive efficient support. For this purpose, Canton implements an information-gathering facility that gathers key essential system information for support staff. If you encounter an error where you need assistance, please ensure the following:
Start Canton in interactive mode, with the
-voption to enable debug logging:./bin/canton -v -c <myconfig>. This provides a console prompt.Reproduce the error by following the steps that previously caused the error. Write down these steps so they can be provided to support staff.
After you observe the error, type
health.dump()into the Canton console to generate a ZIP file.
This creates a dump file (.zip) that stores the following information:
The configuration you are using, with all sensitive data stripped from it (no passwords).
An extract of the log file. Sensitive data is not logged into log files.
A current snapshot on Canton metrics.
A stacktrace for each running thread.
Provide the gathered information to your support contact together with the exact list of steps that led to the issue. Providing complete information is very important to help troubleshoot issues.
Remote Health Dumps
When running a console configured to access remote nodes, the health.dump() command gathers health data from the remote nodes and packages them into resulting zip files. There is no special action required. You can obtain the health data of a specific node by targeting it when running the command. For example:
remoteParticipant1.health.dump()
When packaging large amounts of data, increase the default timeout of the dump command:
health.dump(timeout = 2.minutes)