- Overview
- Tutorials
- Getting started
- Get started with Canton and the JSON Ledger API
- Get Started with Canton, the JSON Ledger API, and TypeScript
- Get started with Canton Network App Dev Quickstart
- Using the JSON Ledger API
- Get started with smart contract development
- Basic contracts
- Test templates using Daml scripts
- Build the Daml Archive (.dar) file
- Data types
- Transform contracts using choices
- Add constraints to a contract
- Parties and authority
- Compose choices
- Handle exceptions
- Work with dependencies
- Functional programming 101
- The Daml standard library
- Test Daml contracts
- Next steps
- Application development
- Getting started
- Development how-tos
- Component how-tos
- Explanations
- References
- Application development
- Smart contract development
- Daml language cheat sheet
- Daml language reference
- Daml standard library
- DA.Action.State.Class
- DA.Action.State
- DA.Action
- DA.Assert
- DA.Bifunctor
- DA.Crypto.Text
- DA.Date
- DA.Either
- DA.Exception
- DA.Fail
- DA.Foldable
- DA.Functor
- DA.Internal.Interface.AnyView.Types
- DA.Internal.Interface.AnyView
- DA.List.BuiltinOrder
- DA.List.Total
- DA.List
- DA.Logic
- DA.Map
- DA.Math
- DA.Monoid
- DA.NonEmpty.Types
- DA.NonEmpty
- DA.Numeric
- DA.Optional
- DA.Record
- DA.Semigroup
- DA.Set
- DA.Stack
- DA.Text
- DA.TextMap
- DA.Time
- DA.Traversable
- DA.Tuple
- DA.Validation
- GHC.Show.Text
- GHC.Tuple.Check
- Prelude
- Smart contract upgrading reference
- Glossary of concepts
Debugging and troubleshooting with lnav
Jumping In
lnav is a log file viewer and navigator that helps you view, search, filter, and analyze log files.
This section gets you started quickly with lnav in CN application development using LocalNet.
Screenshots and instructions are made with lnav version 0.13.1.
lnav download & documentation
Download lnav for your OS at the lnav download page.
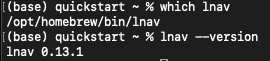
You can check the location of lnav on your machine with which lnav.
Display the version of lnav with lnav --version.
If you’re unfamiliar with lnav, read their docs.
Install Canton lnav format
The Canton Network has a custom lnav configuration to help you view and analyze Canton logs.
The configuration is defined in JSON and lives in the open source Hyperledger Labs Splice repository.
You can read the schema to understand available values and the construction of logs when debugging with lnav in CN applications.
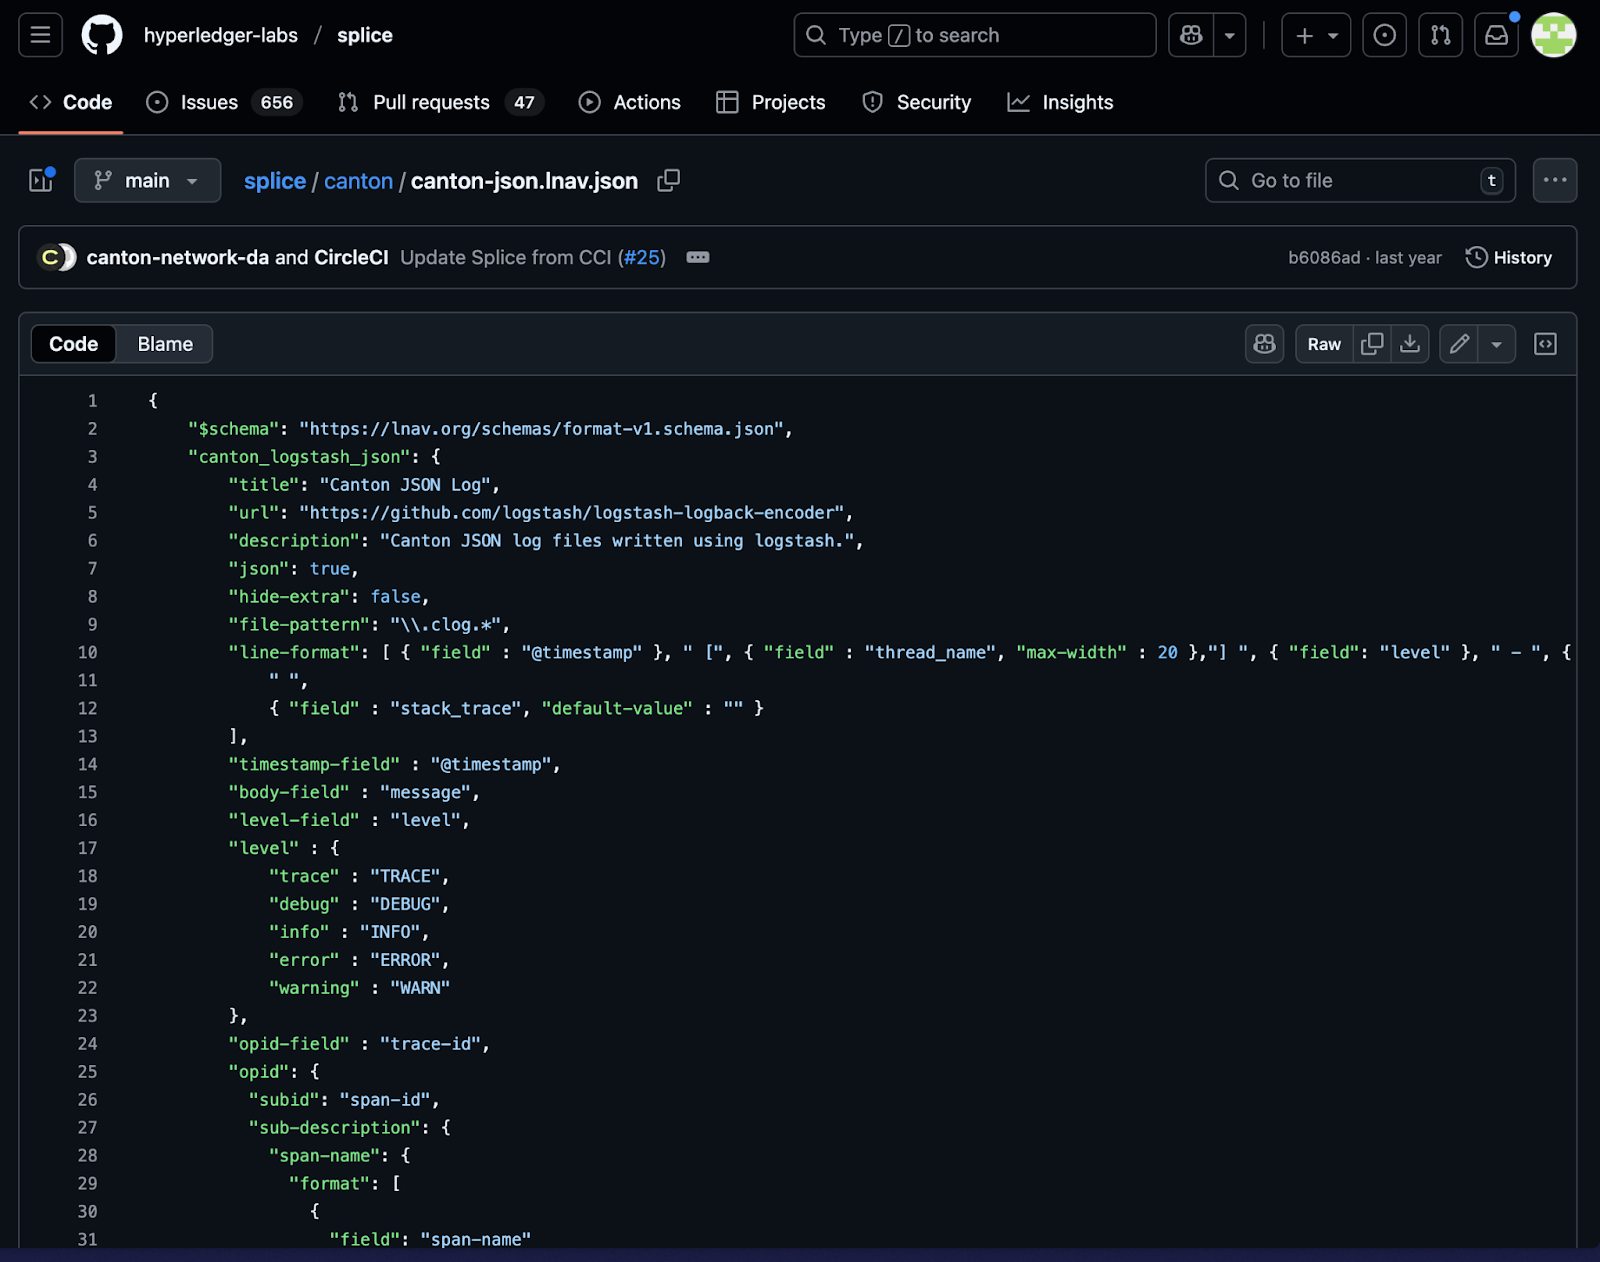
splice/canton/canton-json.lnav.json
Download the configuration and install it for lnav usage:
curl -L https://raw.githubusercontent.com/hyperledger-labs/splice/main/canton/canton-json.lnav.json -o /tmp/canton-json.lnav.json && lnav -i /tmp/canton-json.lnav.json
Now you’re ready to navigate CN logs with lnav.
Capture Quickstart logs
To capture logs for all the quickstart containers, from the quickstart/ directory, run make capture-logs.
Allow the terminal running capture-logs to operate in the background.
Then, in a separate terminal run make start to launch the containers.
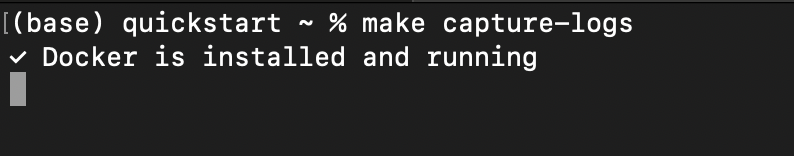
Start make capture-logs in terminal 1
Find the logs
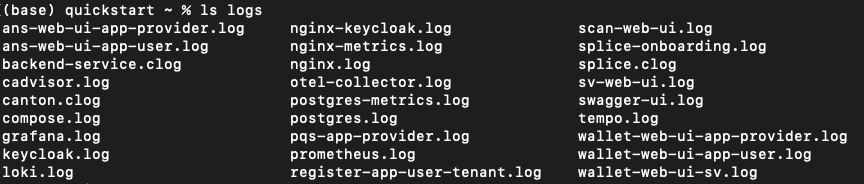
The containers create logs in the logs/ directory while running, starting from initialization.
See the available logs by running ls logs.
Canton logs
clog pronounced “c-log” are Canton logs that follow the custom Canton log formatting, as mentioned above.
clogs are generally used for long-running services such as Canton and Splice, while the standard log files usually indicate initialization scripts and utilities.
View live clogs by running lnav logs/*.clog from the quickstart/ directory.
(Exit at any time by pressing “q” or typing “:quit”)
The clogs show a live stream of logs emanating from Canton, Splice, and backend services.
Navigating events
In the terminal, create a business event to trace by running make create-app-install-request from the quickstart/ directory.
Return to lnav.
Pause and unpause the stream as needed while working through this guide by pressing “=”.
Search for an event
Create a search for “AppInstallRequest” by typing /AppInstallRequest.
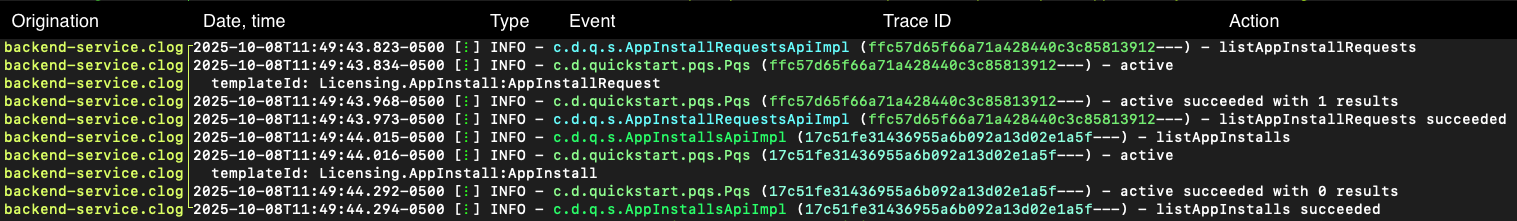
Use “n” and “shift + N” to jump through entries containing “AppInstallRequest”. “>” and “<” scroll horizontally across long entries.
Press “shift + G” if you need to jump to recent entries. This will resume the live stream, if unpaused.
Filter an event
To focus on events of interest, make a “filter-in” search with :filter-in AppInstallRequest
Unlike search, which highlights matches within the log stream, :filter-in shows only log entries that contain the requested information.

Clear filter-in results
Return to the live stream with :reset-session.
If you return to a blank log, use q to quit and reenter lnav with lnav logs/*.clog.
Generate events for analysis
Perform a complete business operation in the Quickstart application to generate traceable events for log analysis.
Quick workflow summary
Log in as
app-provideratlocalhost:3000Accept the install request
Create a license
Issue a license renewal request
Log in as
app-userand make the payment in the Canton Wallet.Accept and allocate payment for the renewal
Return to the app as
app-providerand complete the renewal
For detailed step-by-step instructions with screenshots, see Explore the Canton Network Application Quickstart demo.
Search by Trace ID
The logs include an OpenTelemetry trace identifier (trace-id) for analysis purposes. A trace ID is useful since they are recorded with logs in different containers. Trace IDs help you follow a single operation across all services. This is a key log analysis technique that you will use frequently.
Find a Trace ID
Find a Trace ID by filtering with :filter-in listLicenses
The Trace ID is the string of characters wrapped in the parentheses.
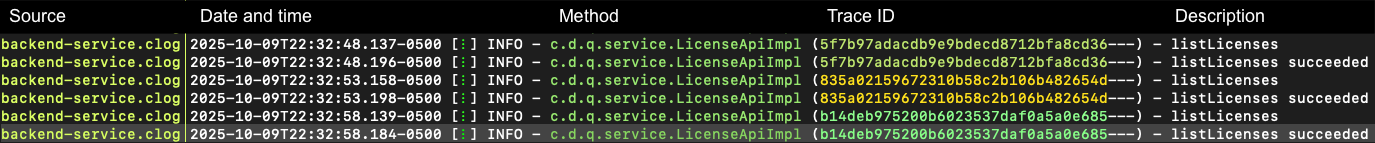
Select and copy the Trace ID of any entry.
For example, “835a02159672310b58c2b106b482654d”
Warning
Your trace ID will be unique. Copying this example will result in 0 results.
Filter by Trace ID
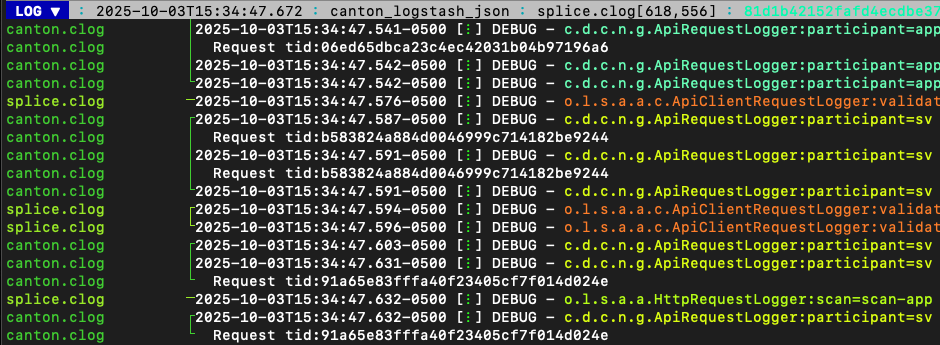
Filter to see only logs related to this specific Trace ID:
:reset-session
:filter-in 835a02159672310b58c2b106b482654d
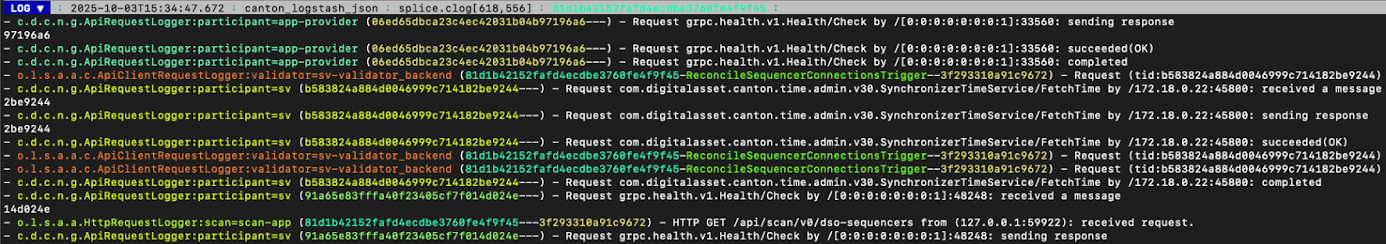
Now, you can view all log entries across any containers that handled this request.

Alternatively, you can search for the trace ID without filtering:
:reset-session
/0f23f6d54af3176a6d4c904ed66e8702
This highlights all occurrences without hiding other logs.
Filter (:filter-in) - When you want to focus exclusively on one operation.
Search (/) - When you want context from surrounding logs.
Further exploration of lnav clogs
The remainder of this guide is intended to increase your familiarization with lnav.
Practice the following commands while in lnav.
Press “g” on the keyboard to go to the top of the logs. “Shift + g” takes you to the end of the logs and reinitiates the stream.
Pause and unpause the stream with “=”.
Use the left cursor key to view the log entry’s file origination point.
Use the right cursor key to view the log entry.
Using “shift + right” and “shift + left” moves the view in smaller increments.
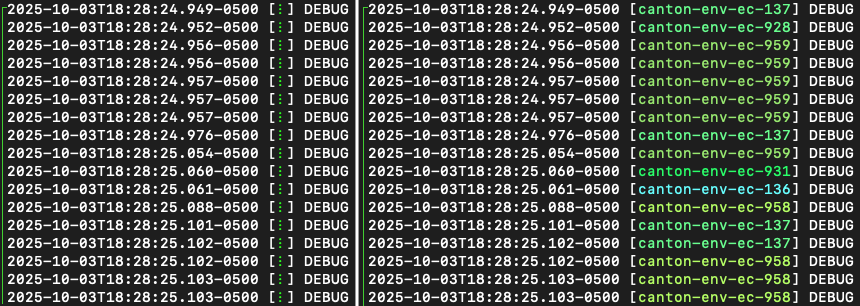
Use “x” to expand and collapse information within the square brackets after the date.
“CTRL + x” toggles cursor mode to move a cursor line.
Mark and copy lines
Use “m” to mark lines.
Copy lines with “c” to mark and copy entries into clipboard.
“m” and “c” allow you to easily share log entries of interest.
“Shift + J” copies subsequent lines.
“Shift + K” unmarks subsequent lines.
“u” and “Shift + U” allows you to jump between marked lines
“Shift + C” clears all marked lines.
Find errors, warnings, and trace IDs
“e” and “Shift + E” jumps between errors
“w” and “Shift + W” jumps between warning messages
“o” and “Shift + O” jumps between traceIds (opId)
Time
“Shift + T” toggles time marks where the selected item is the center of time. The smaller the digit the closer to the event the log is and the larger the number, the further from the event. Time is demarcated in seconds.

Command mode
As a Canton Network developer, command mode gives you precise control over log navigation, filtering, and analysis-essential functions for isolating trace IDs, filtering by service component, or narrowing down time windows when debugging distributed Canton operations. This section highlights a few of the most commonly used commands.
Enter command mode with the colon key, “:” then type your desired command.
To scroll through command history, press “:” followed by the up arrow.
A small selection of available commands are showcased in the Appendix section below.
Read the lnav documentation for a full list of available commands.
Help
For detailed documentation of any command use :help or “?”.
Exit help with “q” or “?”
Prune logs
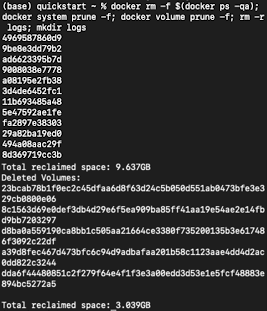
From time to time you may desire to prune logs. You can prune all logs and start with a fresh logs subdirectory with:
docker rm -f $(docker ps -qa); docker system prune -f; docker volume prune -f; rm -r logs; mkdir logs
You need to run make start to resume operations after running this command.
Troubleshooting
If lnav crashes it may also force quit the capture logs script and delete all of the files in the logs/ directory.
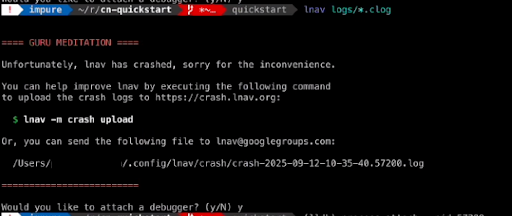
To rebuild logs/ and its *.clogs files,
you need to make stop && make clean-all and then make start from the quickstart/ directory.
Appendix
Correlation mechanisms
Canton Network uses several correlation and filtering mechanisms that can be used to search, sort, and analyze log entries:
level- Log level (TRACE, DEBUG, INFO, WARN, ERROR)logger_name- Component identifiermessage- Log message contenttrace-id: OpenTelemetry trace identifierspan-id: OpenTelemetry span identifierspan-parent-id: Links spans in trace hierarchyspan-name: Operation name@timestamp- Timestamp
Let’s look at examples to better understand each of these correlation mechanisms.
2025-10-09T22:03:41.702-0500 [⋮] DEBUG - ⋮ (---) - ⋮
Timestamp:
2025-10-09T22:03:41.702-0500Collapsed metadata including the thread_name:
[⋮]Log level:
DEBUGSeparator:
-More collapsed content:
⋮No active trace (not part of distributed tracking):
(---)
2025-10-09T22:22:08.976-0500 [⋮] DEBUG - ⋮ (846ff12a35f6e8b61171039527934709-SvOffboardingSequencerTrigger--6aaa9f37e9ae78c4) - ⋮
Trace ID:
846ff12a35f6e8b61171039527934709Span name:
SvOffboardingSequencerTriggerSpan ID:
6aaa9f37e9ae78c4
2025-10-09T22:22:08.978-0500 [⋮] DEBUG - ⋮ (2a2f0baca0ce4452d713a30d9a5bcb7d---) - Request com.digitalasset.canton.topology.admin.v30.TopologyManagerReadService/ListSequencerSynchronizerState by /172.18.0.22:43954: received a message
Trace ID:
2a2f0baca0ce4452d713a30d9a5bcb7dLog message:
Request com.digitalasset.canton.topology.admin.v30.TopologyManagerReadService/ListSequencerSynchronizerState by /172.18.0.22:43954: received a messageThe three hyphens
---indicates that there is no span-name (it would be after the first of the three hyphens) and that there is no span-id (which would be after the final two hyphens).See the previous example to review how the trace-id, span-name, and span-id are formatted.
Advanced filtering
Common Field Reference
The following structured fields are present in Canton Network logs and can be used in lnav filter expressions to search, sort, and analyze log entries.
Filter by Severity
:filter-in level = 'ERROR'
:filter-out level = 'DEBUG'
Filter by Component
:filter-in logger_name =~ '.*sequencer.*'
:filter-in logger_name =~ '.*participant1.*'
Filter by Trace
:filter-in trace-id = '2a2f0baca0ce4452d713a30d9a5bcb7d'
:filter-in span-name =~ '.*Transfer.*'
Filter by Time Range
:filter-in @timestamp >= '2024-01-01 10:00:00'
:filter-in @timestamp < '2024-01-01 11:00:00'
Filter by Content
:filter-out message =~ 'health.*check'
:filter-in message =~ 'license'
Hide lines
You can hide lines that match specific patterns using the following commands:
:hide-lines-beforehides lines that come before the given date.:hide-lines-afterhides lines that come after the given date.:hide-fieldshides certain fields in each line.
You can hide fields types including logger_name, thread_name,
ipaddress, @timestamp, stack_trace, span-parent-id, trace-id, @version, and level.
You can hide more than one field type at a time.
For example, if you wanted to hide thread_name and level you’d use:
:hide-fields thread_name level
Hide lines before
# Hide logs before a specific time
``:hide-lines-before 2025-10-10 14:30:00``
# Hide logs before the last hour
``:hide-lines-before -1h``
# Hide logs before a specific line number
``:hide-lines-before 1000``
Hide lines after
# Hide logs after a specific time
:hide-lines-after 2025-10-10 16:00:00

# Hide logs after a specific duration from start
:hide-lines-after +2h

# Hide logs after line 5000
:hide-lines-after 5000
Show lines
:show-lines-beforeshows lines that were previously hidden before a specific time, duration, or line number.:show-lines-aftershows lines that were previously hidden after a specific time, duration, or line number.
Gathering logs contents into a directory
Use one of the following commands from quickstart/, based on your operating system, to gather the logs directory content into a single folder:
tar -czf my-cn-logs.tar.gz logs/
zip -r my-cn-logs.zip logs/